
 NEAR Protocol
 Bitcoin
 Aerodrome Finance
 Pearl
Pearl Uniswap
 Quantus
 Pudgy Penguins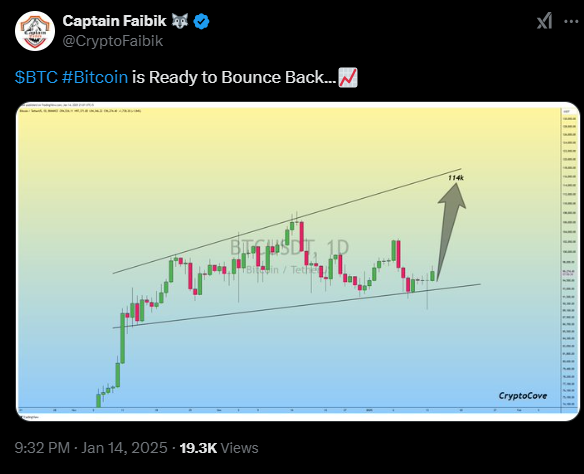
- Bitcoin has strong bullish momentum, sustaining above the $95K resistance and trading at $97,416.
- Standard Chartered warns of a 10% drop if $90K support breaches.
- Despite market uncertainty, the firm predicts a target of $200K by 2025.
In the last few sessions, Bitcoin‘s (BTC) price has seen significant price retracement. It took support around the $90k demand zone and saw a bounceback.
According to Standard Chartered’s Geoffrey Kendrick, the Bitcoin price may breach the $90k support zone. If this happens, the token could see a potential decline toward the $80k mark.
However, the BTC price succeeded in sustaining above the $95K resistance and displays bullish momentum. It was trading at $97,416 at press time, noting a rise of over 2.64% in the past 24 hours.
Bitcoin Price Could Reach $200K by 2025: Here’s What Analysts Say
A recent Standard Chartered report highlighted that a break below $90K could open the doors toward the $80K. However, the firm remained optimistic about Bitcoin and maintained its long-term bullish outlook.
The firm hints that a break above the ATH high could pave the way toward $200K by the end of 2025. Notably, the Bitcoin price has retested the 61.8% Fib retracement level. Furthermore, it is ready to kick off the next bullish leg above the $105K mark.
Crypto Analyst Captain Faibik pointed out a bullish setup. The analyst said the BTC price was trading inside a wedge pattern. Moreover, it was primed for a rise toward the $114k mark in the short term.
Large Transactions Surge Fueled Bitcoin Price Rally
One significant contributor to Bitcoin’s recent rebound is the rise in large transactions. IntotheBlock’s data showed that substantial transactions significantly rose and soared to 20.21K.
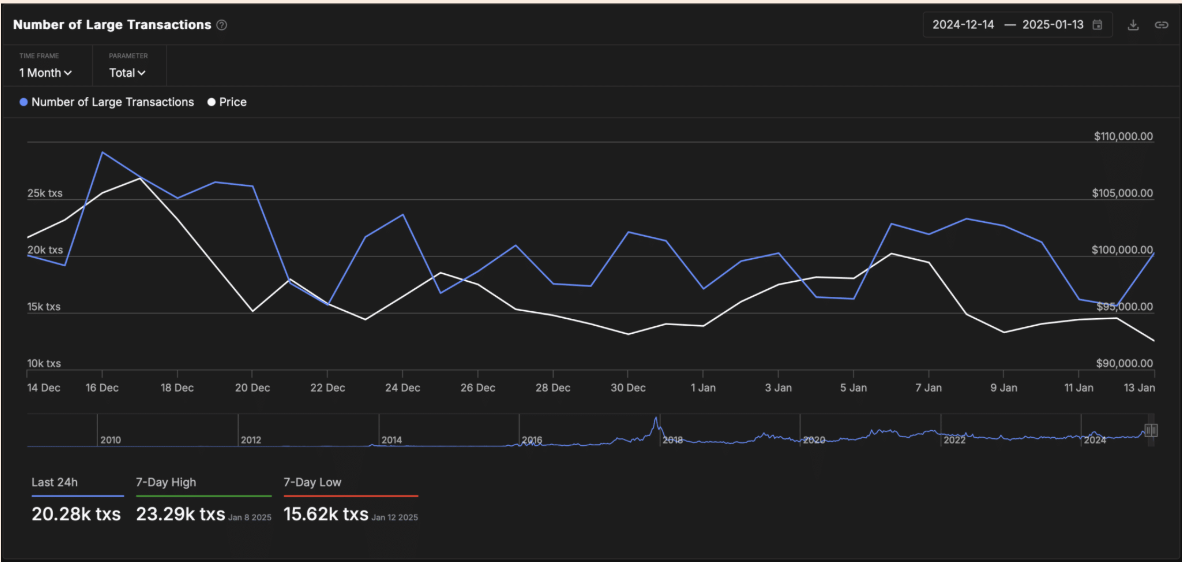
This suggested that the Bitcoin price has gained momentum. It also indicated that large investors accumulated the coin during the recent dip.
Bitcoin Price Analysis: What Do Charts Suggest?
From a technical standpoint, Bitcoin’s daily chart showcased a falling wedge pattern. Notably, the BTC price sustained gains above the key EMAs. Furthermore, the token seemed to break the $100K mark in the following sessions.
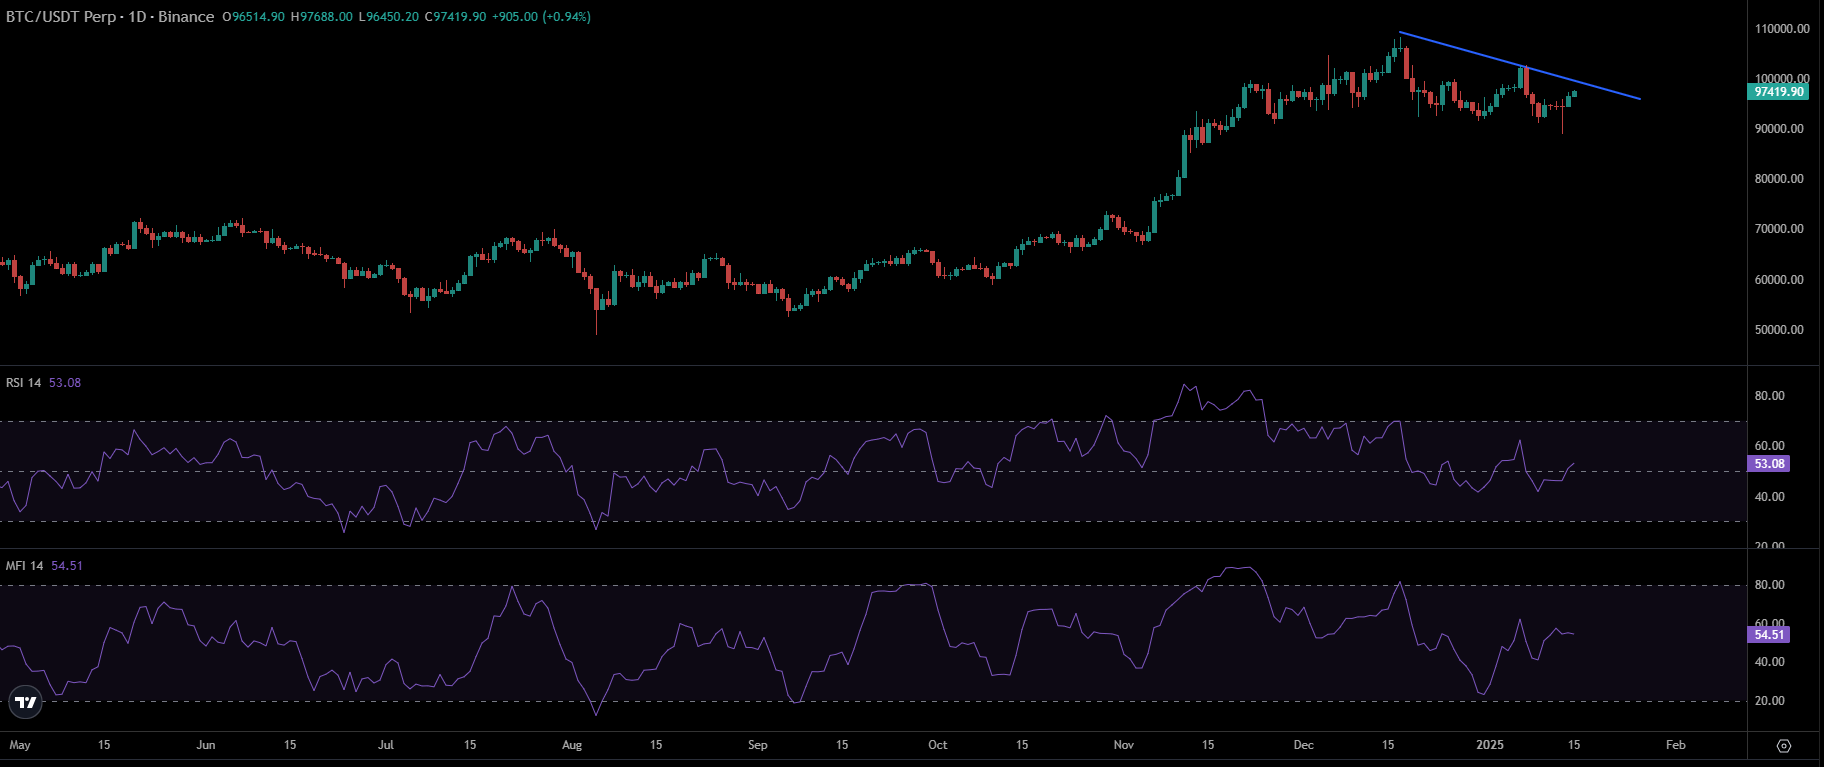
The Relative Strength Index (RSI) line was 52, showcasing neutral readings. However, it signals a healthy buying momentum and suggests further room for significant growth.
The Money Flow Index (MFI) line was also above the neutral 50 mark. That highlighted sustained inflows into the market. The Bitcoin price action signified a rebound and accumulation pattern.
It conveyed that, despite the retracement, large investors have used the buy and dips strategy. They have also added more long positions for the upward rally in the short term.
Futures Market Data Outlook
Data from Coinglass highlighted that Bitcoin’s Open Interest (OI) has risen over 1.20% to $61.40 Billion in the last 24 hours. That represented long additions.
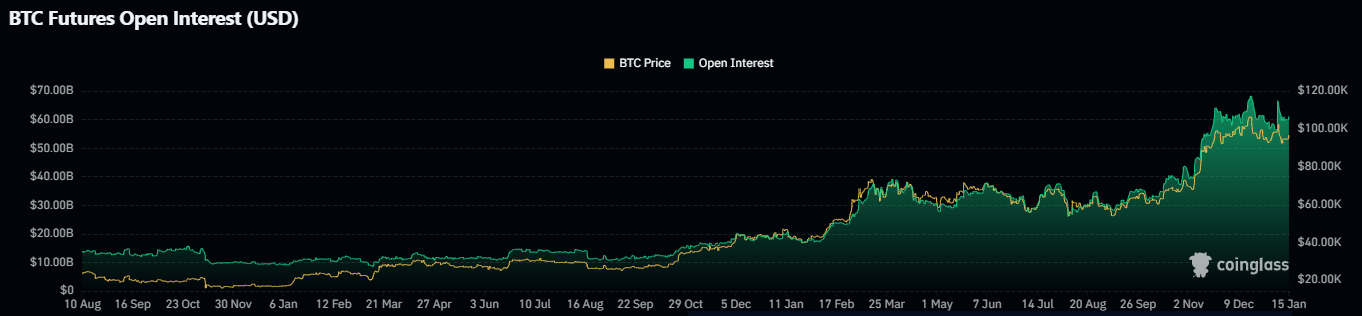
Also, the OI-weighted funding rate stayed positive at 0.0076%. That highlighted steady demand for the long positions.
Moreover, the Long/Short ratio across exchanges was at 1.0416, which indicated a bullish bias. Typically, a ratio above the 1 mark implies that long contracts outweigh short ones.
The immediate support zones for the Bitcoin price were $92,280 and $90,120. At the same time, the upside hurdles were $98,900 and $100,000.
Disclaimer
This article is for informational purposes only and provides no financial, investment, or other advice. The author or any people mentioned in this article are not responsible for any financial loss that may occur from investing in or trading. Please do your research before making any financial decisions.




