
 streamoors
 Injective
 Pudgy Penguins
 Celestia
 Pearl
Pearl Sui
Sui Bitcoin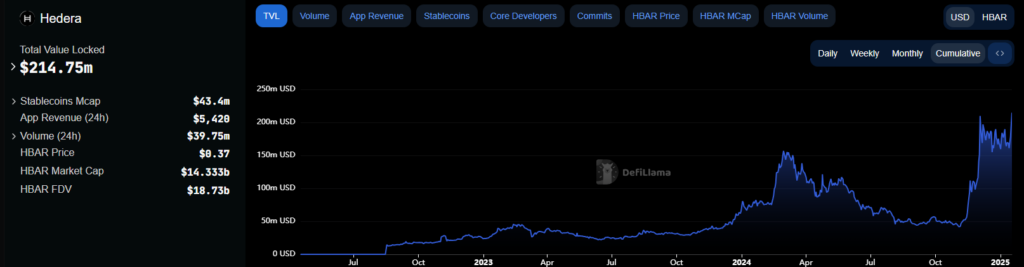
- HBAR price showed a sharp rally, surged over 33% this week.
- On-chain data and technical indicators paint a bullish picture.
Hedera Hashgraph (HBAR) posted a massive bullish rally on Friday and extended its weekly gains to 33%, revealing bulls’ dominance.
At press time, HBAR price was trading at $0.3725, witnessing a rise of over 7.90% in the past 24 hours. The trading volume rose over 78% and the market cap soared to $14.24 Billion, noting a 4% surge intraday.
What’s Driving the Recent Price Surge?
On Wednesday, HBAR Foundation announced a strategic partnership with Vaultik and the World Gemological Institute. This partnership is to tokenize $3 Billion worth of diamonds, gemstones, watches and jewelery as Real World Assets (RWAs) on the Hedera network.
Such partnerships can accelerate Hedera’s expansion in the crypto sphere. Moreover, this has instilled confidence and faith among investors.
On-Chain Metrics Reveal Bullish Outlook
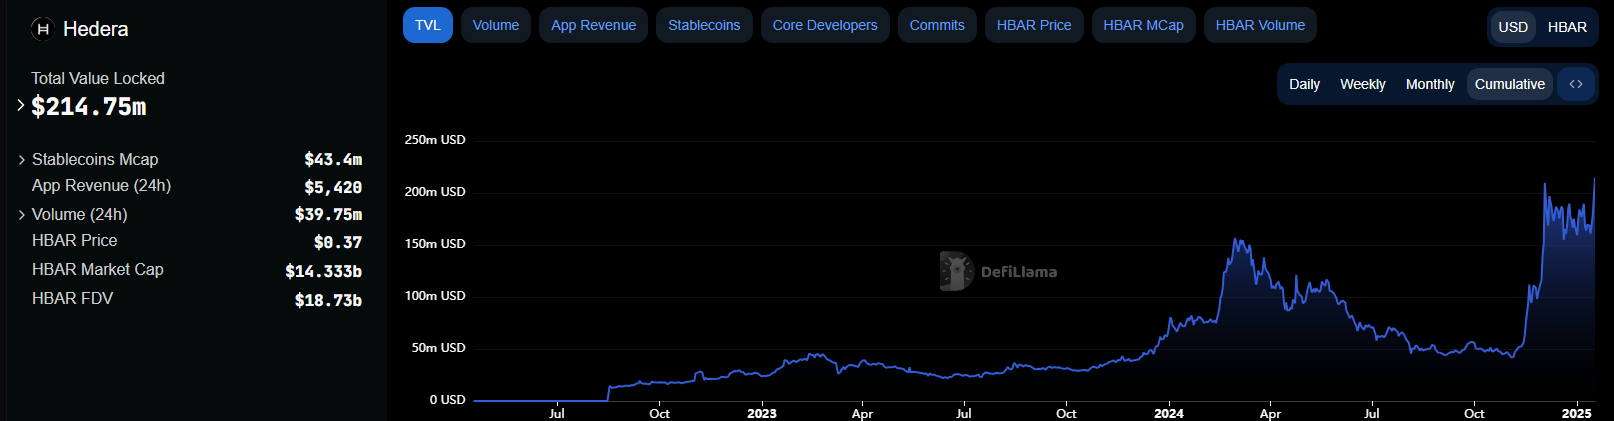
Data from DeFiLlama revealed that HBAR’s Total Value Locked (TVL) noted a massive rise, reaching record highs at $214.75 Million. This significant surge in TVL highlights growing investor confidence and market interest for the token.
Additionally, HBAR’s development activity noted a sharp surge in the past two weeks, soaring to the 98 mark.
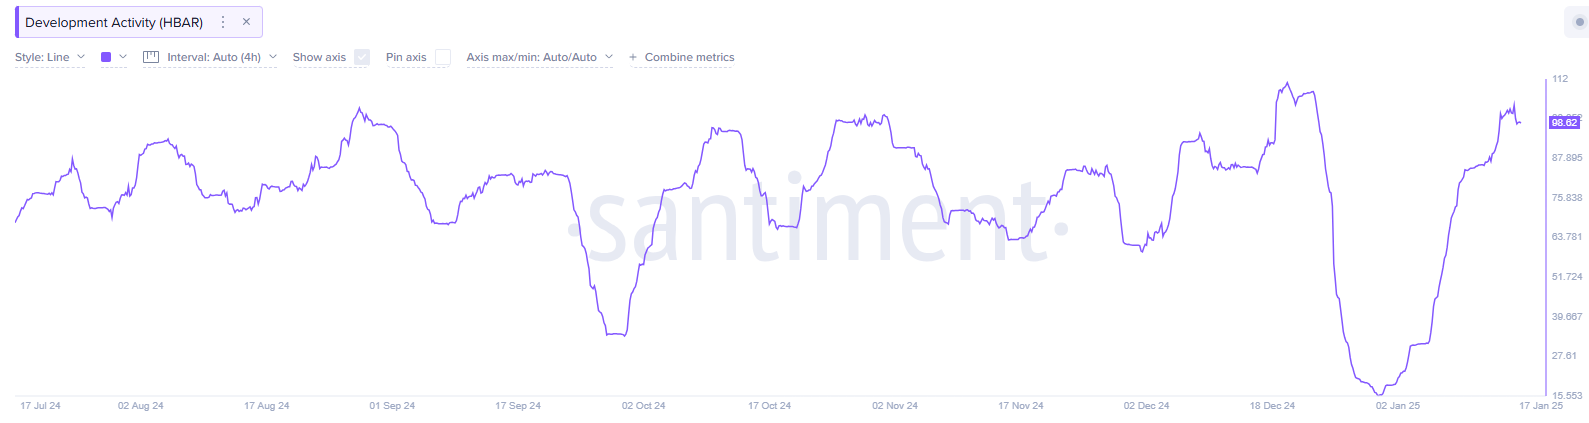
This heightened activity suggested a commitment to innovation and potential enhancements in the network’s capabilities.
HBAR Price Analysis: A Multi-Year Breakout Imminent?
A recent post on X shows Altcoin Sherpa highlighted that HBAR crypto has completed a 3-year old downtrend and recouped its gains. It was on the edge of a multi-year breakout and could see a massive rally.
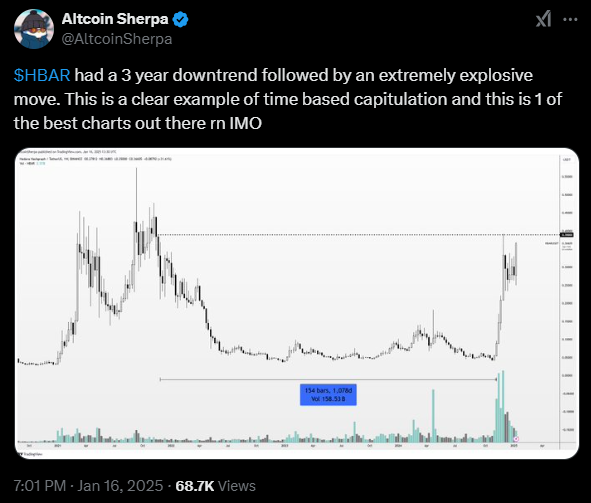
It shows an example of time-based capitulation and saw an explosive reversal. Once it breaks the $0.4000 high, it could revisit its ATH zone of $0.5700 in the short term.
Hedera price reveals a textbook symmetrical triangle pattern breakout and was attempting to breach its previous month’s trajectory. The current momentum is strong as buyers are accumulatingn the altcoin.
The Relative Strength Index (RSI) reached the overbought zone at 65, replicating a positive crossover on the chart.
While, the Average Directional Index (ADX) was at 43, replicating a strong upward trend and the Chaikin Money Flow (CMF) value of 0.12 hinting at a strong liquidity inflow into the market.
Once HBAR price forms a daily close above the $0.4000 mark , it could see an explosive upsurge and could break the ATH mark soon.
What do Futures Data Suggest?
In the last 24 hours, the Futures Open Interest rose over 8.45%, implying sharp long buildup activity.
A look at the long/short ratio on various exchanges, it revealed that long contracts have outweighed the short contracts, a bullish sign.
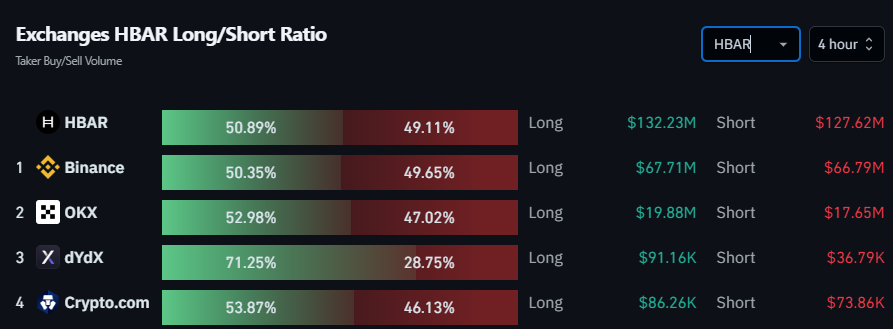
Amidst the sharp surge of over 30% in a week, a massive short liquidation was noted and short traders looked underwater now.
The immediate support zones were $0.3500 and $0.3320, whereas the resistance levels were $0.4000 and $0.4200.
Disclaimer
This article is for informational purposes only and provides no financial, investment, or other advice. The author or any people mentioned in this article are not responsible for any financial loss that may occur from investing in or trading. Please do your research before making any financial decisions.




