
 Zerebro
 Bitcoin
 Aerodrome Finance
 ZKsync
 Pearl
Pearl Pudgy Penguins
 Bitway
- XRP is above the Bull Market Support Band, signaling bullish momentum similar to past rallies.
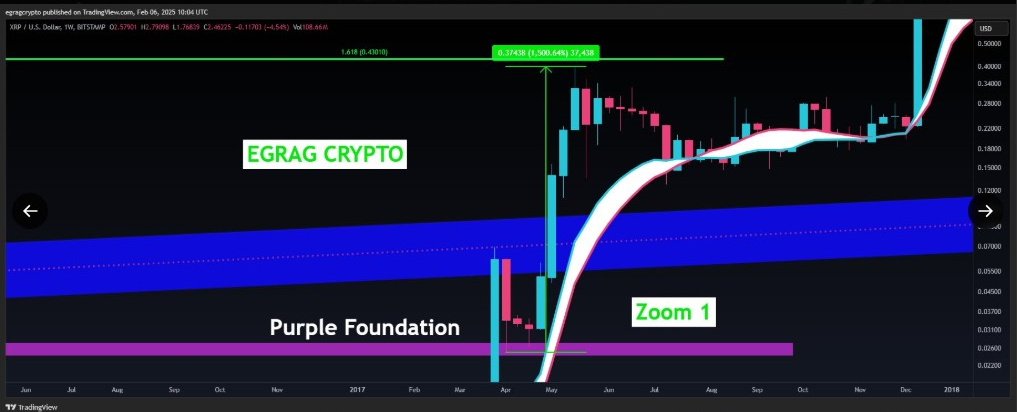
- The Purple Foundation level has historically acted as a launchpad for XRP’s massive price surges.
- If history repeats, XRP could surge 1500% to $27, aligning with Fibonacci level 1.618.
XRP price is trading above the Bull Market Support Band (BMSB), a key indicator that signals bullish momentum.
Analysts have pointed to this technical level as a defining factor in differentiating between bearish and bullish phases for the crypto. Analysts suggest that maintaining this position strengthens the probability of an extended uptrend.
Historical price trends indicate that each time XRP price has positioned itself above this band, significant rallies have followed.
Analysts have drawn comparisons between the present market conditions and past cycles. In 2017, the XRP price experienced a rapid 1,500% increase within weeks. If this pattern persists, market analysts anticipate similar movement in the coming period.
The Purple Foundation Level as a Launchpad for XRP Price Surge
The Purple Foundation level has consistently served as a critical support zone in past market cycles. This price region has historically acted as a launchpad for major price surges, marking it as a crucial level for investors to monitor.
In 2017, XRP touched this foundation level before experiencing a sharp rally that saw prices skyrocket toward the Fibonacci 1.618 extension. Analysts have observed that the crypto recently tested the same support zone, suggesting a similar breakout could be on the horizon. Should XRP replicate this movement, traders speculate that the price could climb significantly in the coming weeks.
Potential 1500% Surge to $27 Aligned With Fibonacci 1.618
In addition, analysts project that if XRP price follows its historical trajectory, it could rally by 1,500%, bringing its price target to approximately $27. This prediction aligns with the Fibonacci level 1.618, a widely followed technical benchmark forecasting potential price peaks.
Currently, XRP is trading above key support levels, reinforcing confidence among investors and market participants.
The Fibonacci extension level has been historically relevant in XRP price movements. Market experts argue that should the asset replicate its 2017 rally, it could reach new all-time highs.
Moreover, recent price analysis has supported the bullish outlook, highlighting XRP hammer candlestick formation as a potential reversal signal. Historically, similar patterns have led to major price surges, with previous instances resulting in gains exceeding 2000% and even 110,000%.
CBOE Files 19b-4 for Four XRP ETFs
Meanwhile, the Chicago Board Options Exchange (CBOE) has submitted 19b-4 filings to the U.S. Securities and Exchange Commission (SEC) for four XRP exchange-traded funds (ETFs).
The filings come from leading asset managers, including Bitwise, Canary Capital, 21Shares, and WisdomTree.
If acknowledged by the SEC, the regulatory review process will begin, with a timeline of up to 240 days for a final decision.
Analysts believe that approval of XRP ETFs could contribute to increased institutional investment, further supporting XRP price rally.
Market observers suggest that ETF approval, combined with historical price behavior and technical indicators, could serve as catalysts for a 1500% XRP rally.
At press time, Ripple price was trading at $2.33, reflecting a 2.7% decline in the past 24 hours. Its market cap stood at $134.85 Billion, with a 24-hour trading volume of $7.24 Billion.
Disclaimer
This article is for informational purposes only and provides no financial, investment, or other advice. The author or any people mentioned in this article are not responsible for any financial loss that may occur from investing in or trading. Please do your research before making any financial decisions.




