
 no crying in the casino
 NEAR Protocol
 Starknet
 Pyth Network
 Pearl
Pearl Quantus
 Pudgy Penguins

Key Highlights:
- Bitcoin’s MC/RC ratio climbs to 2.1, signaling rising market speculation and momentum.
- Short-term holder metrics show renewed buying after a cooldown near key reset levels.
- RSI and Stochastic RSI flash bullish patterns, echoing pre-rally setups.
Bitcoin is heating up in speculative valuation. The MC/RC ratio has reached 2.1, signaling increasing momentum.
Bullish RSI signals and strong ETF inflows, driven by BlackRock, indicate growing momentum. Market dynamics suggest BTC could rally to $120,000 in the coming months.
Valuation Metrics Show Bitcoin Momentum Building Gradually
Recent data shows that Bitcoin’s current Market Cap to Realized Cap (MC/RC) ratio is 2.1. This figure is 31% above the smoothed three-year average of 1.6.
Historically, when the MC/RC multiple exceeds this level, it signals increased market activity and potential price growth.
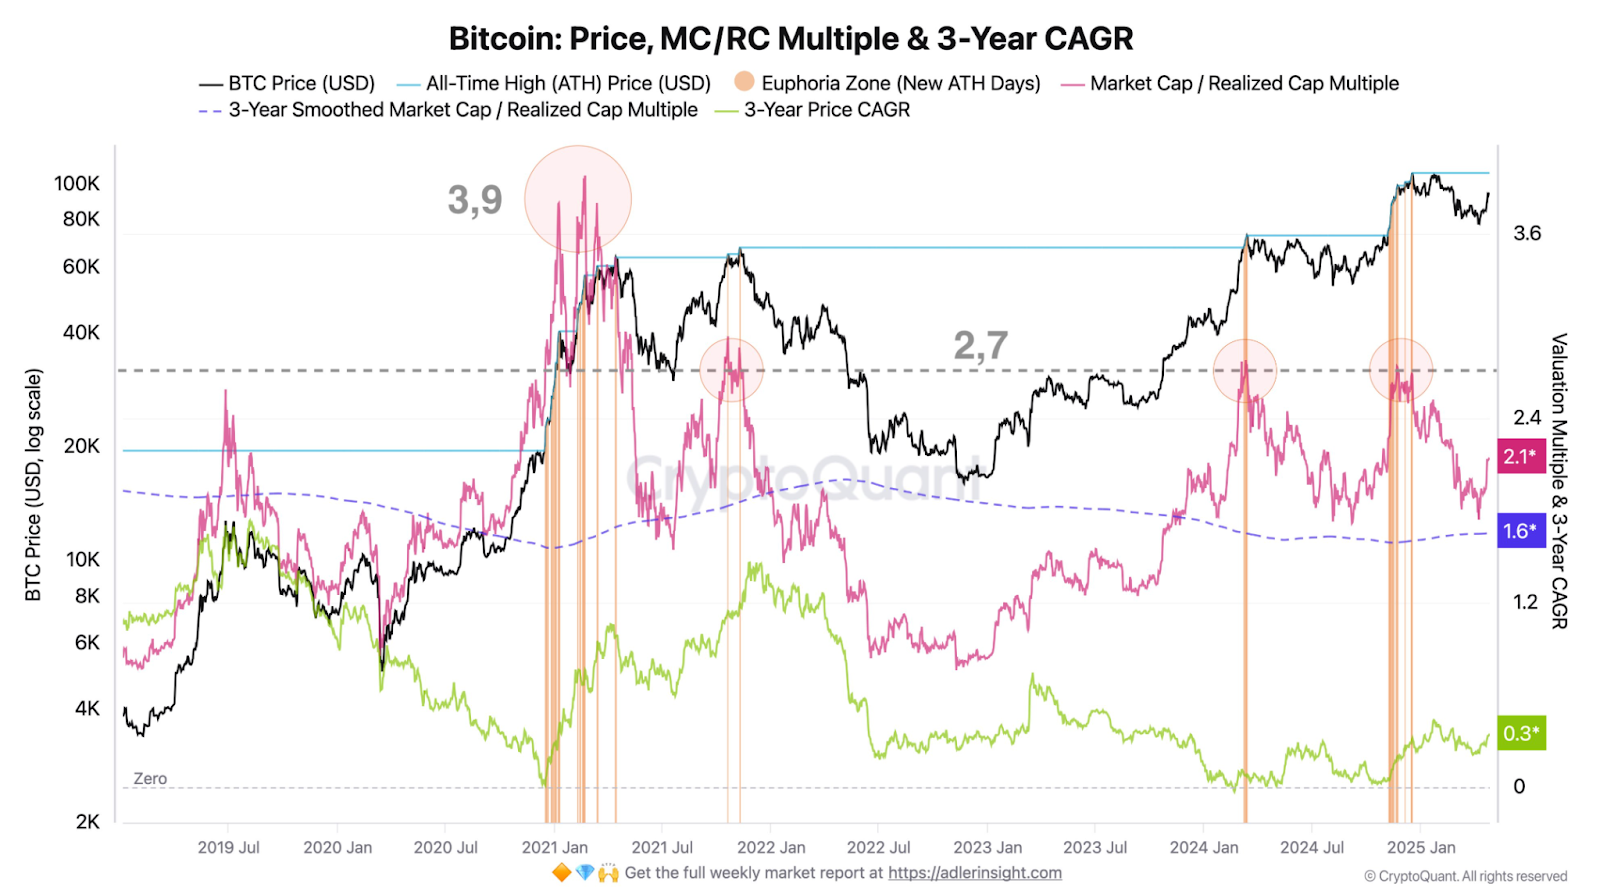
The previous bull cycles peaked when the multiplier was at much higher levels. For instance, the 2021 top was in line with a 3.9 multiple, and a 2.7 reading in 2022 was corrected.
Using this data, a Bitcoin price of $120,000 would imply a return to a 2.7 multiple from the current 2.1 level. If the market reflects the 3.9 reading, a projected price of about $175,000 is conceivable.
This is accompanied by a 3-year compound annual growth rate (CAGR) of about +30%. That’s far below the +120% CAGR from the 2021 peak.
While short-term indicators are strengthening, this lower reading reflects that the longer-term return momentum of BTC is still building.
Bitcoin Short-Term Holder Momentum Suggests Renewed Participation
On-chain data shows that short-term holder (STH) momentum is rising again. During the Bitcoin market’s cooldown phase, the STH Cap Ratio declined. This key metric, which gauges newer capital against overall short-term valuation, dipped to nearly 1.3.
That level often coincides with market resets, especially if followed by fresh buying. The latest data indicates a shift in market dynamics.
Dots are transitioning from cooler to warmer zones, suggesting rising momentum. Newer entries on the chart highlight increasing activity and potential bullish movement.
In the past, when the ratio went above the 1.5–2.0 range and turned yellow or red, the market was more expensive. These warm-to-hot zones often accompany new rallies or top phases.
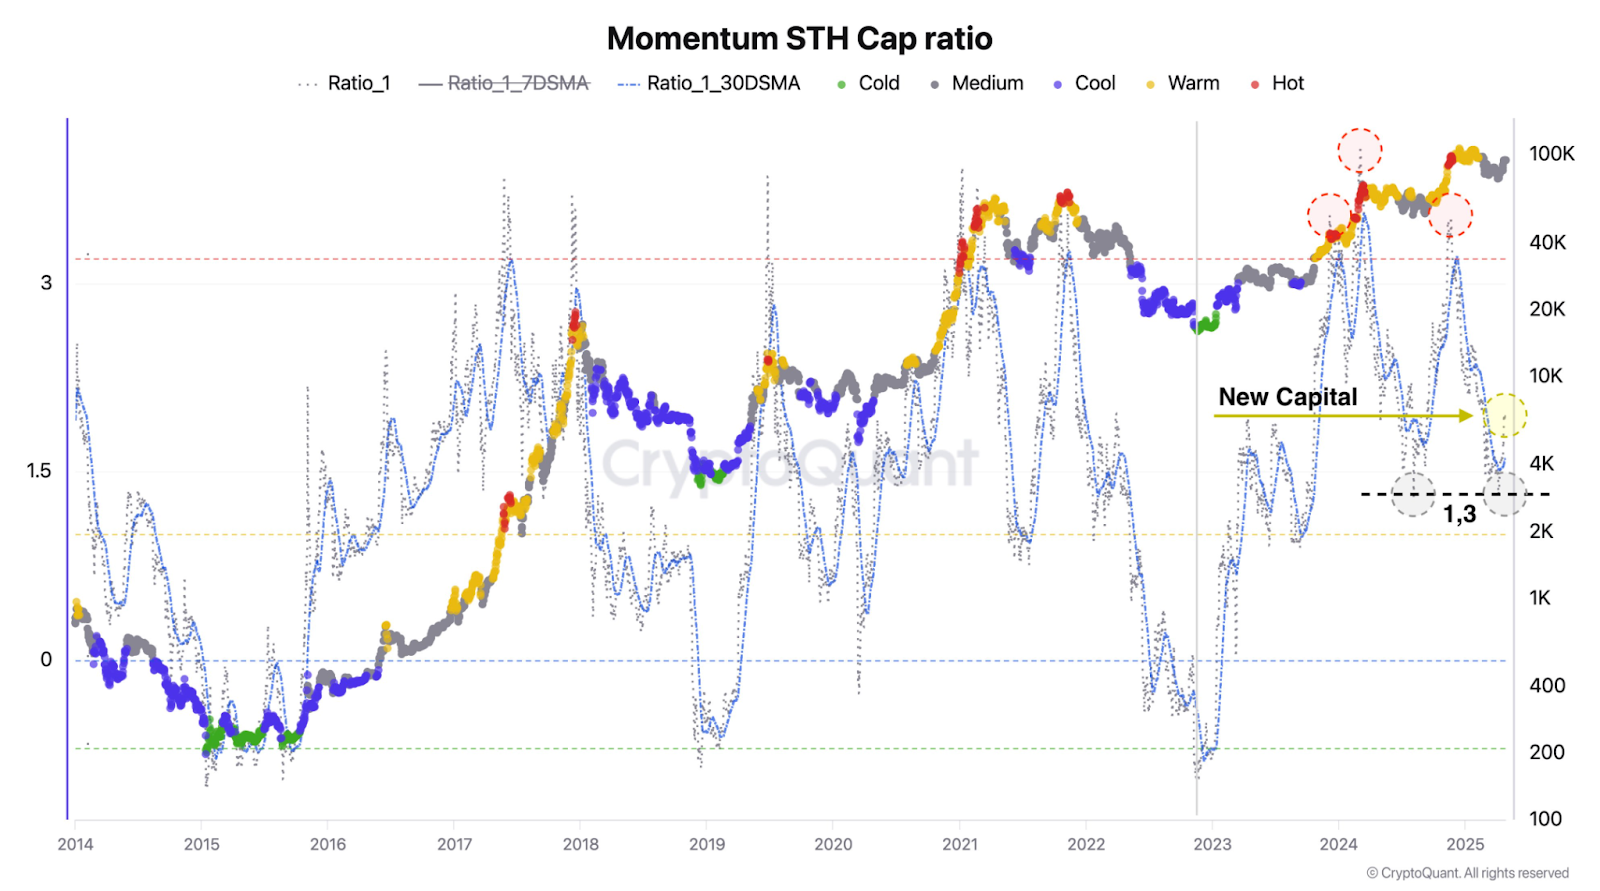
New capital is reentering after a period of price consolidation. This pattern aligns with previous cycles, where cooler phases led to extended accumulation periods. BTC often expanded afterward, following sustained market growth.
Bullish RSI Patterns Suggest Possible Dogecoin Breakout Ahead
Another technical setup is the RSI (Relative Strength Index) and Stochastic RSI indicators. The momentum is shifting upward again after a recent 1-week RSI breakout and a 2-week bullish cross.
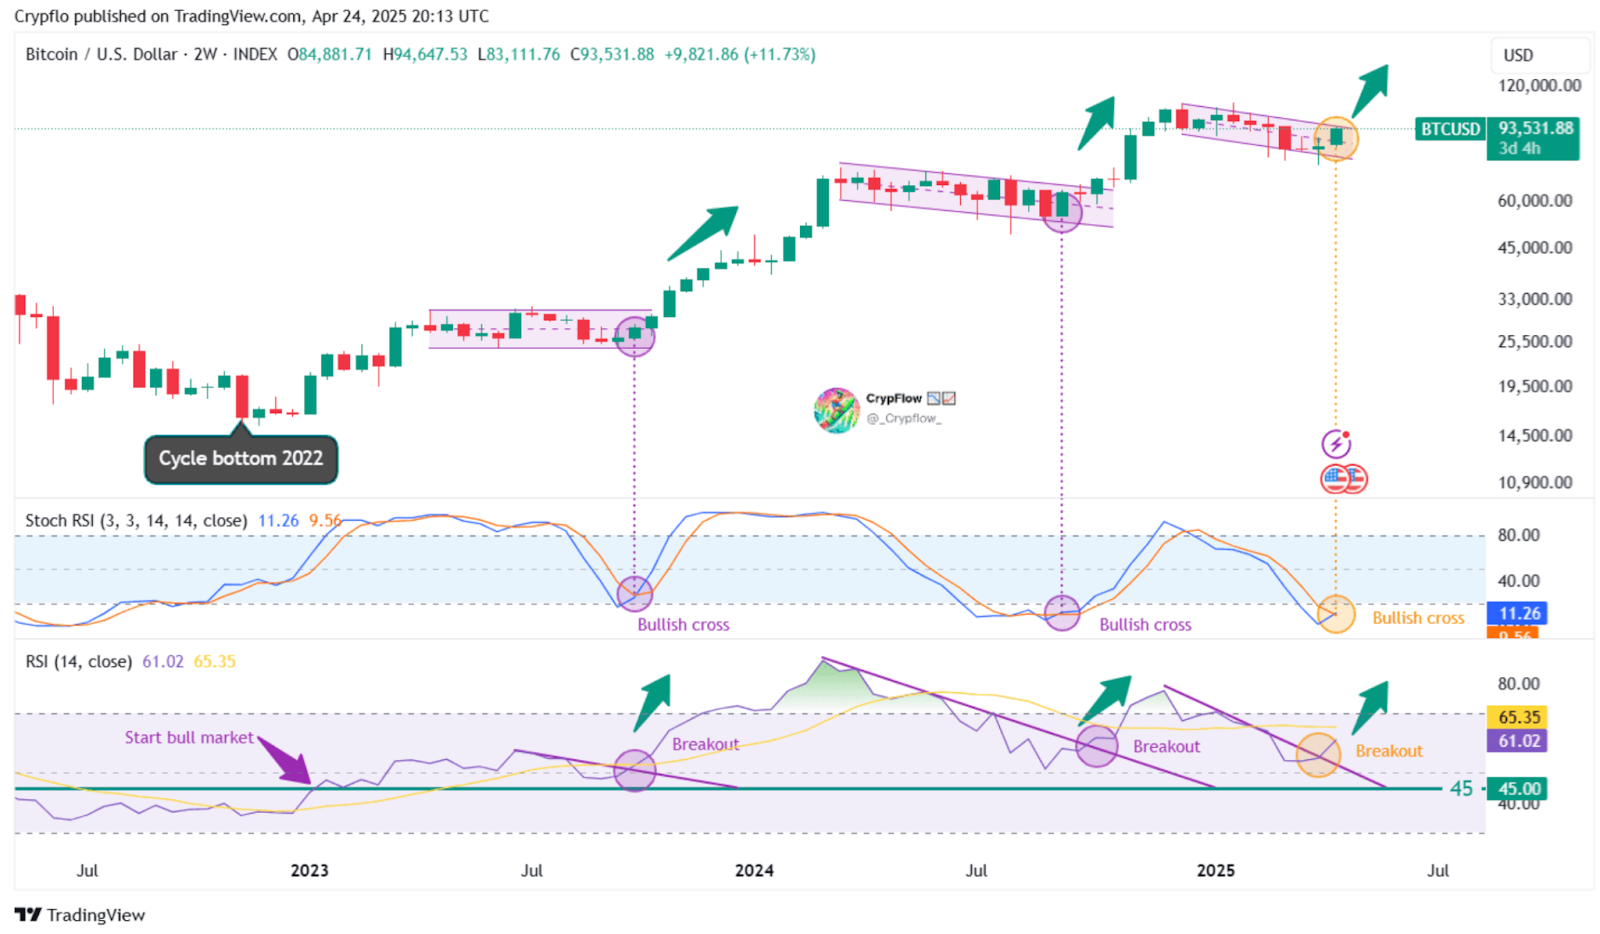
It can be seen from the chart that the last two significant upswings followed similar setups. After a bullish Stochastic RSI cross, they broke out and followed extended sideways ranges.
Here, Bitcoin price broke out of a consolidation zone at about $83,000 and is trading above $93,000. Such technical setups don’t give exact targets but imply that the trend is getting stronger.
Furthermore, that move could be accelerated by rising liquidity and fresh institutional demand. BlackRock’s IBIT saw $970.9 Million in net inflows on Monday, indicating that investors are back in the market and prices are rising.
SoSoValue data shows ARKB experienced $226.3 Million in outflows. Meanwhile, FBTC saw $86.9 Million exit the market. Capital is shifting into stronger positions, reflecting evolving investment trends.
Although trading volume declined from $3.3 Billion to $2.4 Billion, ETF net inflows surged. The total reached $39.02 Billion, marking the highest level since February 2025.
Disclaimer
In this article, the views, and opinions stated by the author, or any people named are for informational purposes only, and they don’t establish the investment, financial, or any other advice. Trading or investing in cryptocurrency assets comes with a risk of financial loss.



