
 astronaut
 Pearl
Pearl NEAR Protocol
 Starknet
 Zcash
Zcash Pudgy Penguins
 Ethena

Key Insights:
- The SuperTrend indicator has flashed a buy signal on Chainlink‘s daily chart for the first time in months.
- If confirmed, Chainlink has formed an inverse head and shoulders pattern, typically signaling a bullish reversal.
- A breakout above the $16–$16.5 range could trigger a 25–30 percent rally in LINK by the first week of May.
Chainlink price has recently attracted attention as technical indicators suggest a potential bullish shift. A buy signal on the daily chart and a classic bullish pattern suggest upward momentum. Traders and analysts are watching price movements closely to gauge the breakout potential.
Chainlink Price SuperTrend Indicator Flashes a Buy Signal
According to crypto analyst Ali Martinez, LINK has had a bullish turn after the daily SuperTrend showed a buy signal. This suggested a reversal of the downtrend after a long period where the Supertrend displayed ‘sell’ signals.
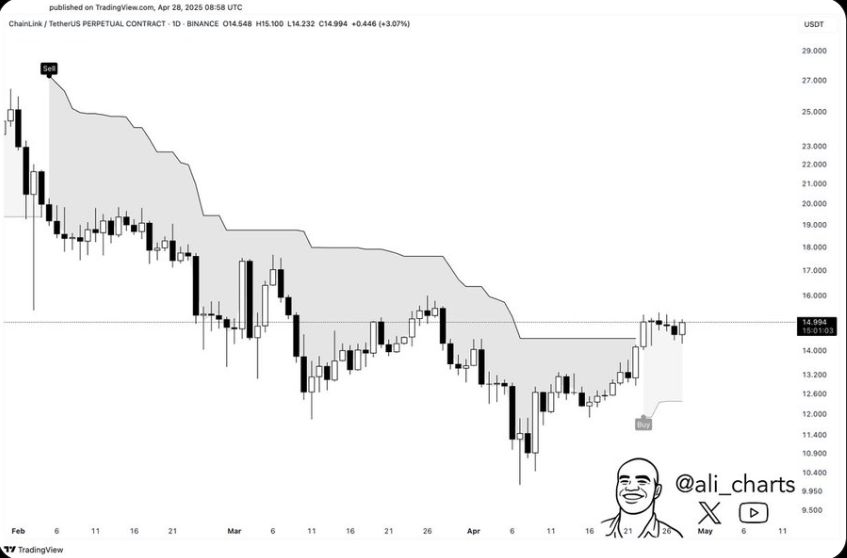
Observing the chart, Chainlink has broken out above the shaded SuperTrend resistance zone for the first time in months. This indicated that buyers are gaining control. This transition from a sell to a buy signal is a bullish reversal signal.
After a brief consolidation phase, the top altcoin trades near the $15 level. Chart analysis suggests price stability, potentially setting up for the next move.
Since April’s monthly low, LINK has consistently formed higher lows, signaling strong upward momentum. This trend strengthens the bullish outlook, suggesting potential for further gains.
The recent breakout above the SuperTrend band suggests that immediate resistance levels around $15–$16 could be tested soon. LINK could break above $15 and target higher levels if it maintains momentum.
The $18-$20 zone, a former support and resistance area, may come into play as traders watch for potential breakout signals.
Chainlink could retrace toward lower supports if it struggles to hold above its breakout level. A drop near $13 may confirm the developing bullish pattern, setting the stage for potential rebounds.
Formation of an Inverse Head and Shoulders Pattern
Along with the SuperTrend buy signal, analyst Ted Pillows noted that LINK has formed an inverse head and shoulders pattern. This was followed by an upward phase if confirmed.
This pattern features three curves, with the central one forming the lowest point. The head is deeper, while the shoulders on either side are less pronounced.
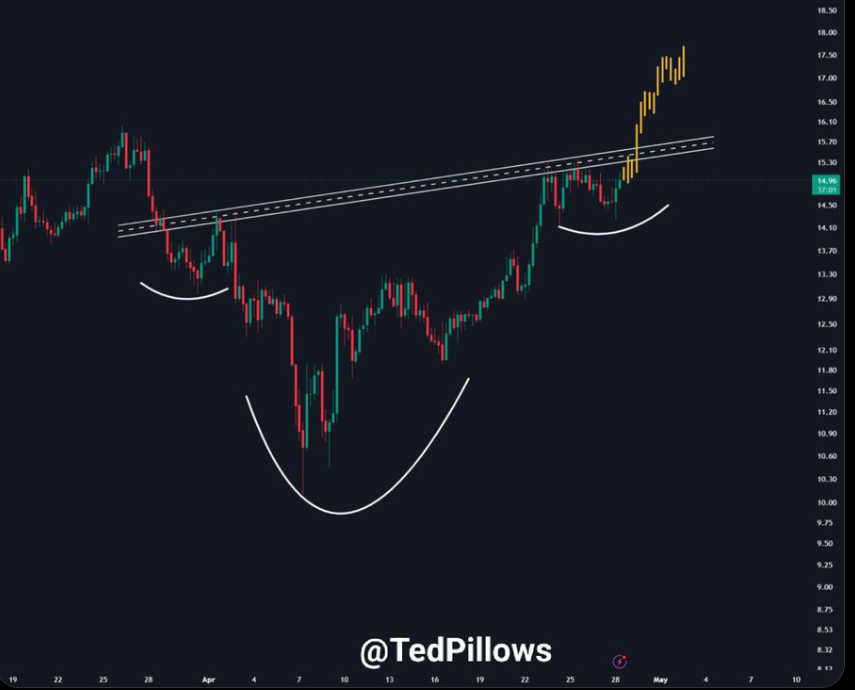
From the figure, the neckline lies in the $16 to $16.5 region. For the pattern to confirm a bullish signal, Chainlink price has to break the neckline to the upside, supported by good volumes.
Based on historical trading data, a completed head-and-shoulders pattern often leads to a price rally. The price movement tends to be proportional to the distance between the head and the neckline, signaling potential upside momentum.
Potential Breakout Above the $16 to $16.5 Range
Analyst Tedpillows highlights that breaking above the $16-$16.5 resistance zone could spark a fresh bullish phase for LINK. Traders closely watch this level as a potential trigger for heightened market activity.
Analyst predictions suggest a successful breakout could propel Chainlink by 25%-30% in early May. Traders are watching closely, anticipating a strong price surge.
Another analyst, FLASH, suggested a bullish outlook for Chainlink as the chart displayed a breakout from a long-term descending channel. LINK price has recently rebounded to the region near $14 – $15 after being in the green accumulation range for some time.
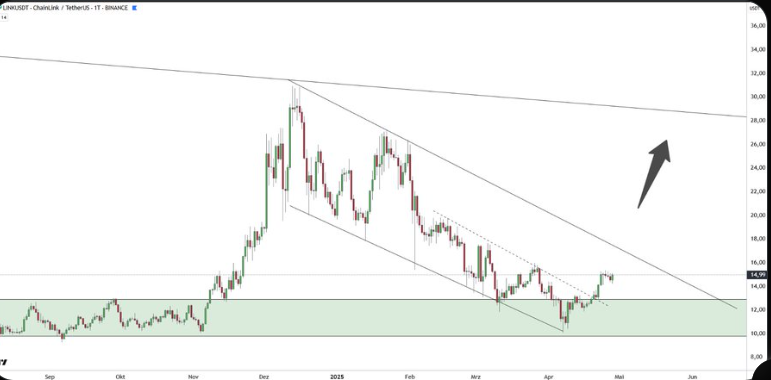
The breakout is accompanied by an upward arrow pointing toward the $24–$26 region, indicating potential for further upside. If Chainlink holds above its former resistance line, it could signal a shift in market sentiment.
This setup suggests a potential trend reversal, setting the stage for a stronger upward move. When writing, Chainlink price was trading at $14.93, up 0.89% in 24 hours, with a $374.62M volume surge of 42.34%. The token showed steady recovery from earlier intraday losses.
Supporting the bullish LINK price predictions, a recent analysis highlighted that the altcoin maintains strong upward momentum. Analysts suggest that breaking above the immediate $15.80 resistance could accelerate LINK’s push toward the $47.15 target.
Disclaimer
In this article, the views, and opinions stated by the author, or any people named are for informational purposes only, and they don’t establish the investment, financial, or any other advice. Trading or investing in cryptocurrency assets comes with a risk of financial loss.





