
 Zerebro
 Bitcoin
 Pudgy Penguins
 NEAR Protocol
 Quantus
 Pearl
Pearl ZKsync

Key Insights:
- 75% of open Dogecoin futures positions are long, reflecting strong bullish sentiment.
- Dogecoin confirmed an inverse head and shoulders breakout, signaling a potential rally.
- DOGE targets $0.25 as traders expect bullish momentum to sustain after a breakout.
Dogecoin price caught traders’ attention because the meme coin formed a bullish inverse head and shoulders pattern. The futures market showed a clear shift in sentiment. This indicated the potential for a DOGE price uptrend.
Dogecoin Price Inverse Head and Shoulders Breakout
Trader Tardigrade noted that Dogecoin price broke out of an inverse head and shoulders pattern on lower time frame charts. This pattern is usually a sign of a bullish trend reversal.
This pattern, characterized by well-defined troughs at the left, head, and right shoulder, shows a strong base structure. The neckline (critical resistance zone) was crossed, meaning the pattern confirmation and the potential for the rising trend.
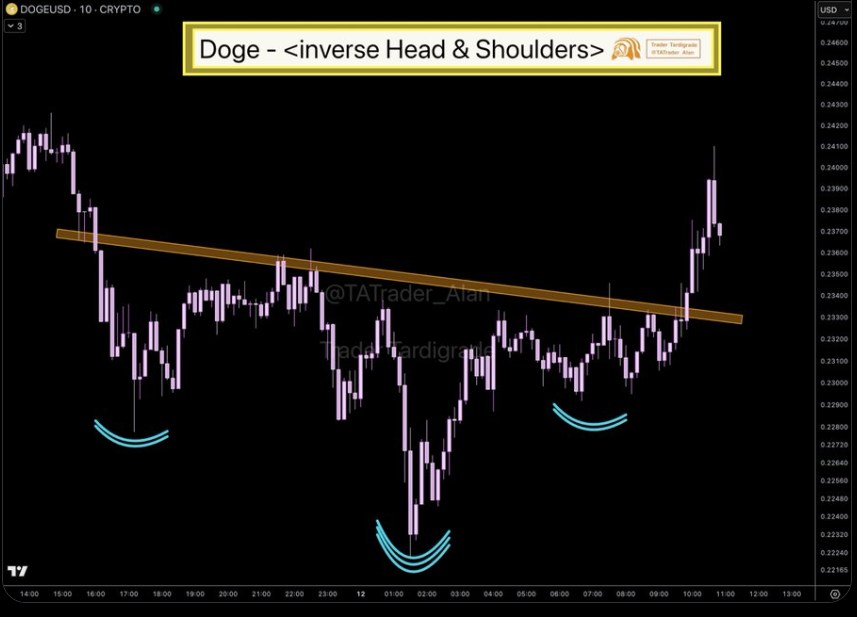
After the breakout, DOGE price surged rapidly, breaking above the neckline. The technical confirmation aligns with bullish predictions.
The token could move to higher price levels in the coming weeks. This setup is a strong reversal signal. If broader market conditions remain favorable, sustained bullish momentum is likely.
Retest Confirms Breakout Validity
More so, recent trading showed a textbook neckline retest, highlighting the breakout’s strength. The retest involved a brief pullback to the former resistance, which has now become support. This created an ideal entry point for traders.
A retest like this usually strengthens the breakout’s credibility. It lowers the chance of a false reversal and boosts the likelihood of sustained upward price movement.
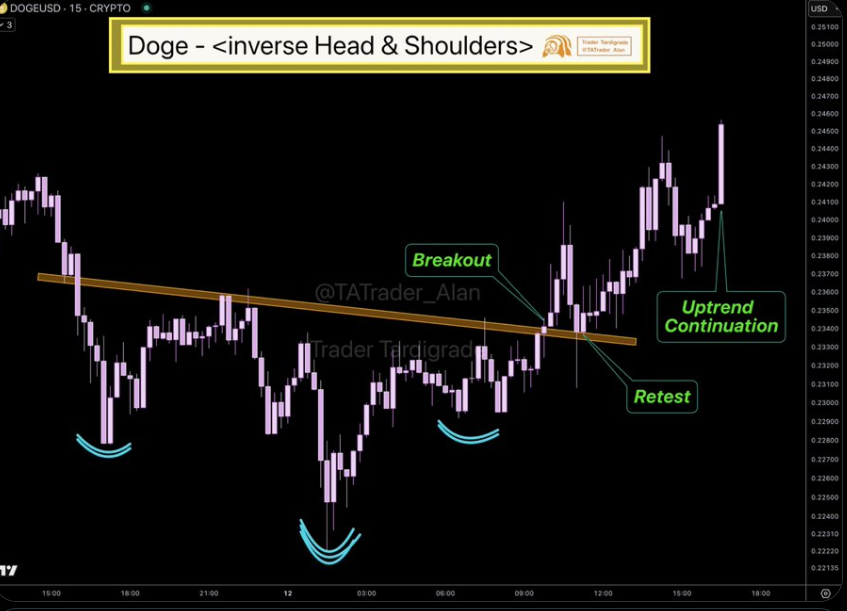
This retest showcased typical market dynamics. A significant resistance was breached, followed by a successful retest. This generally signals growing confidence among traders.
With this critical structure intact, DOGE short-term outlook is bullish. If buying pressure persists, the Dogecoin price could move toward the $0.25 to $0.265 range.
Futures Sentiment Backs Bullish Outlook
Binance Futures data published on May 11 indicated strong trader confidence, reiterating the bullish technical setup. On May 11, long positions in active Dogecoin futures accounted for 75.01%.
This was much higher than the 24.99% in short positions. The strong 3:1 ratio of long to short positions signaled clear bullish sentiment. Most traders anticipated the price would keep rising.
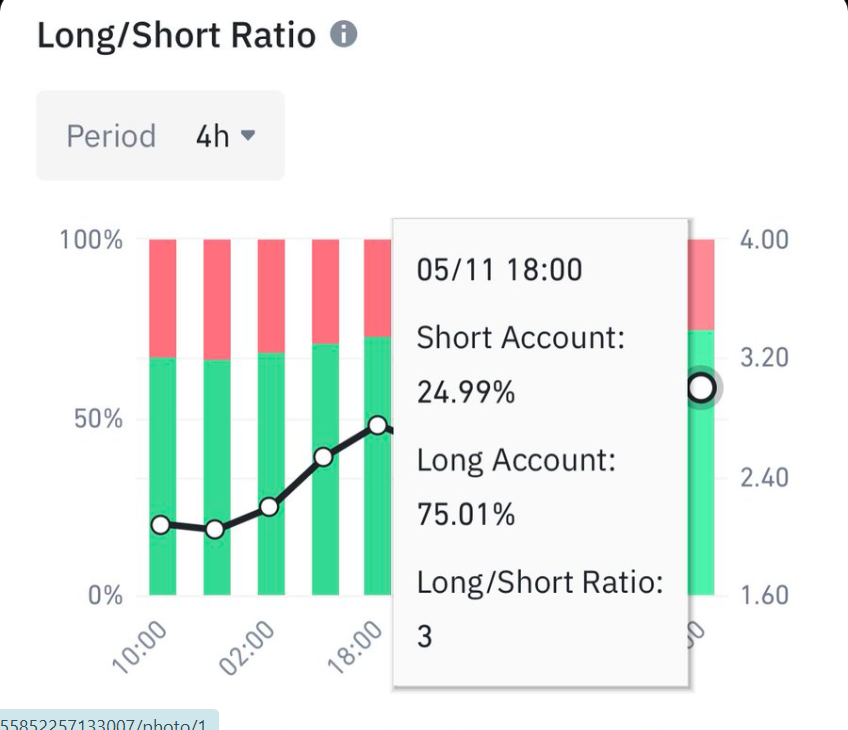
The long-position surge indicated that traders were preparing for a larger upward move. This could align with the technical breakout.
Extreme positioning can sometimes cause volatility if market sentiment changes. This makes it a crucial factor for traders to consider.
Weekly Close Above Key Support Signals Potential 62% Upside
A recent update from Rekt Capital showed that the Dogecoin price achieved a weekly close above previous levels. These levels were last recorded before the halving event.
This development is bullish because DOGE price has re-entered the former resistance-turned-support zone at $0.220. According to the weekly chart, sustaining above this support could further push DOGE toward the $0.278 zone.
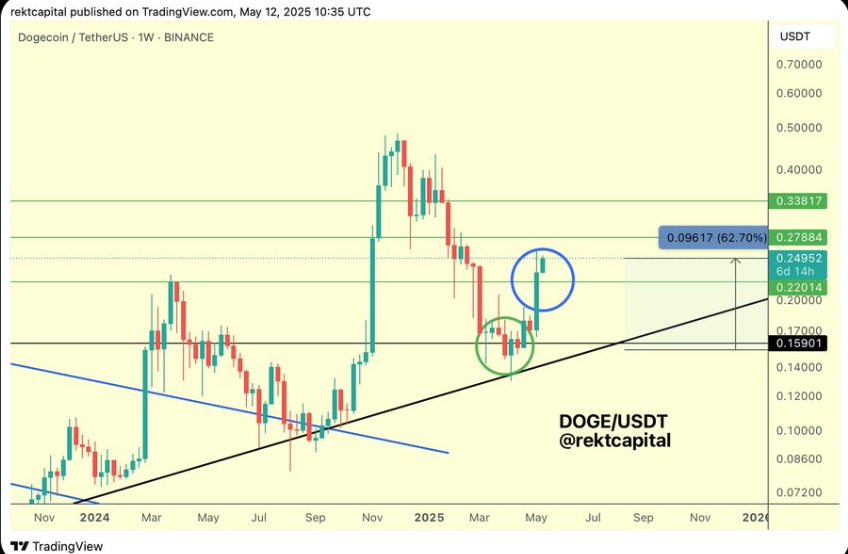
Furthermore, the weekly chart showed a strong rally from the long-term trendline, reinforcing the bullish sentiment. If Dogecoin price keeps rising and surpasses the $0.278 resistance, the next target could be $0.338.
This would mark a 62.7% increase from the current price. This outlook aligned with the broader bullish sentiment observed in recent market data. Meanwhile, a recent technical analysis spotted a rounding bottom breakout on Dogecoin price chart, pointing to a possible 55% gain.
The breakout above $0.20 set the stage for a potential move to $0.3159. This aligns with the broader bullish trend, as open interest surged to a 30-day high.
Disclaimer
In this article, the views, and opinions stated by the author, or any people named are for informational purposes only, and they don’t establish the investment, financial, or any other advice. Trading or investing in cryptocurrency assets comes with a risk of financial loss.




