astronaut
 Pearl
Pearl NEAR Protocol
 Starknet
 Zcash
Zcash Pudgy Penguins
 Ethena

Key Insights
- Avalanche price went up by 6%, showing gains, though it is battling resistance at $24.50 to $27.
- A break below the key support level of $22 could set off a quick fall to both $21 and $19 because of high risks for liquidation.
- AVAX is currently expected to trade between $22 and $25, but may break out toward $30 if the resistance is cleared on increased trading.
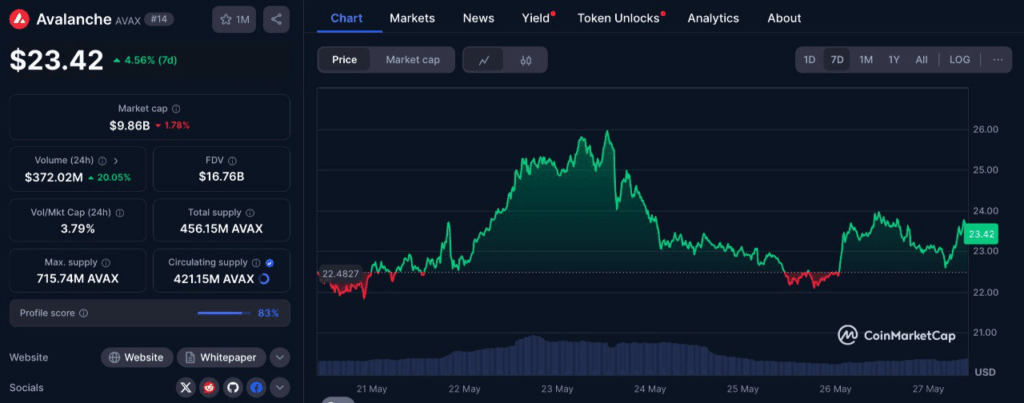
Avalanche climbed 6% to $23.42, building on a 4.56% weekly gain as the Layer-1 token attempts to reclaim key resistance levels. The rally comes amid renewed interest from buyers following a pullback from $27.
Despite a 1.78% drop in market cap to $9.86 billion, the rise in price reflects accumulation after last week’s decline. The volume-to-market cap ratio of 3.79% signals active circulation. Of the 715.74 million maximum supply, 421.15 million AVAX are currently in circulation.
Avalanche Price Daily Chart Signals Bullish Bias, But $22 Support Is Key
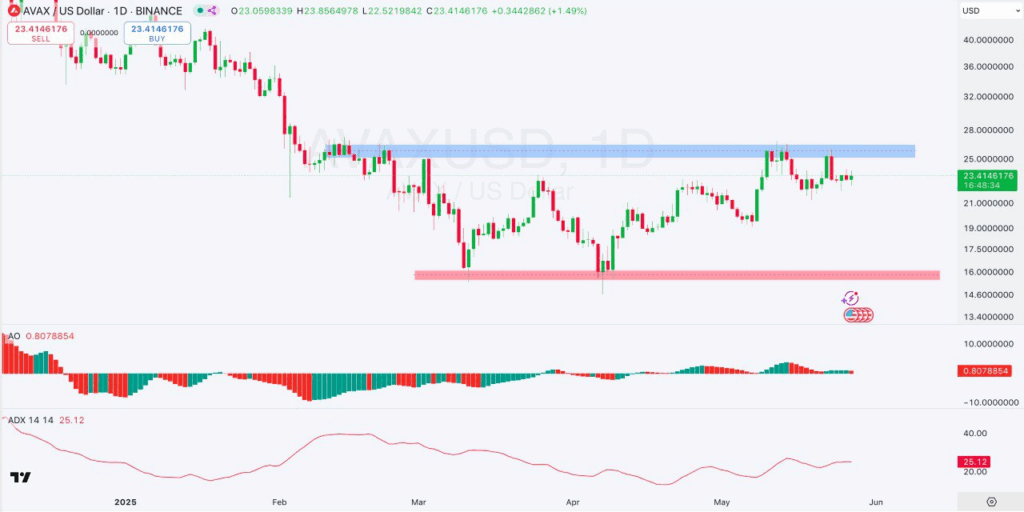
Daily charts indicate that Avalanche is still in a bullish structure after the recent selling. The cost of Dogecoin is $23.41 right now, near the $24.50 to $27.00 level which has acted as resistance previously. In the past few months, this blue zone has caused selloffs because it has been a limit to supply. AVAX can reach the $30 level only if it strongly reclaims this resistance zone with good volume.
A positive signal of 0.80 is being printed by the Awesome Oscillator, indicating bullish momentum, even though the histogram is not large. Despite a slowly strengthening trend shown by the Average Directional Index (ADX), it is still not firmly in an aggressive stage yet.
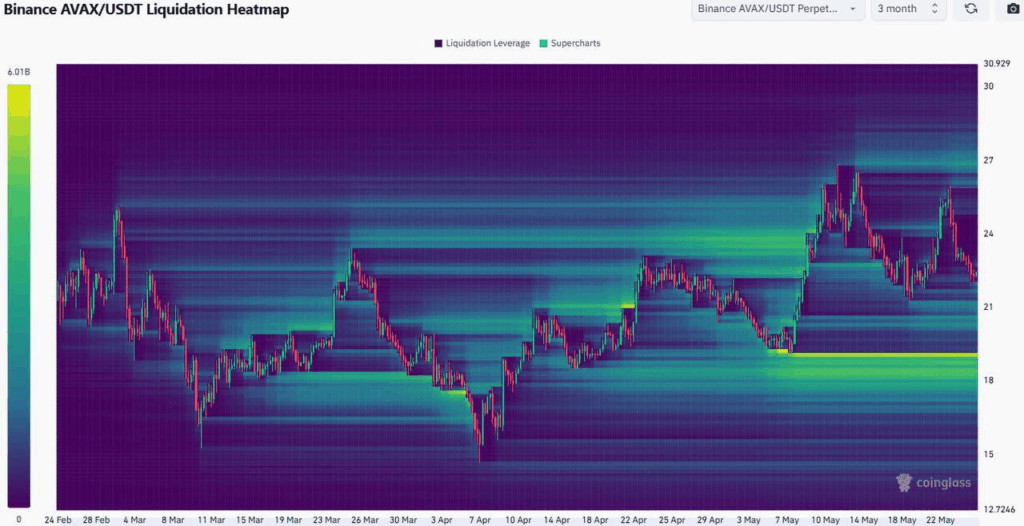
More and more, $22.00 is becoming a key point for the market. If anything were to happen to the hedging strategy, the asset would be exposed to extra risk. Near the bottom, liquidity gets very crowded below $21.50 and $21.00, able to be seen on the liquidation heatmap from Coinglass. Should the market tumble further, it could lead to fast losses, as the next key liquidity attraction is at $19.00.
Heatmap Shows Key Liquidation Zones Driving the Avalanche Price Action
Looking at the Coinglass liquidation heatmap for Binance’s AVAX/USDT pair clarifies the trend of where prices may move. Elevated liquidation leverage is shown in the heatmap at the $21 to $24 price range. As a result, failing to hold the $22.00 support could result in a stronger fall in this area.
Areas highlighted in bright green on the heatmap between $24 and $27 indicate greater trading and open interest which may pull prices up should the market continue to rise.
After $27, the heatmap shows gradually decreasing liquidity which signals that a fast change could occur once the price moves above resistance near $30.
Over the past week, the price rose sharply from $22.48 on May 21, reached $26.14 on May 23, but plummeted afterward. The drop leveled off at $22.50, then Avalanche consolidated and made higher lows. The current trend implies a higher accumulation before $25 is retested.
Although Bitcoin has not reached the weekly peak, the price returning to $23.42 is encouraging, thanks to rising daily volume and new confidence in the market. If Bitcoin holds above $24.50, it’s likely to keep moving up, but a drop below $22 would signify that it’s losing momentum.
Given the current chart structure and liquidity zones, AVAX appears poised to range between $22 and $25 in the near term. If bullish pressure increases and the $25– $27 resistance band is cleared with volume, a run toward $30 becomes more likely. This target coincides with historical supply zones and thin liquidity seen on the heatmap, suggesting fewer obstacles on the path up.
On the downside, failure to hold above $22 would activate liquidity traps at $21 and $19. A move toward these levels could occur quickly, as leverage unwinds and forced liquidations mount.
Disclaimer
In this article, the views and opinions stated by the author or any people named are for informational purposes only. And they don’t establish the investment, financial, or any other advice. Trading or investing in cryptocurrency assets comes with a risk of financial loss.