Bitcoin
 Starknet
 Pearl
Pearl ZKsync
 NEAR Protocol
 Quantus
 Zerebro

Shiba Inu price has declined over the past week, from around $0.0000145 to approximately $0.0000123. Despite minor rebounds, the overall trend has remained decisively bearish. This recent slide adds to a broader technical setup that has been developing since 2021.
Analyst Aram Salimi, via TradingView, has highlighted critical chart patterns suggesting strong long-term resistance and previously established support. These levels and fresh derivatives market data show growing uncertainty as SHIB approaches pivotal price points.
Long-Term Resistance Limits Shiba Inu Price
Aram Salimi’s analysis highlighted a descending resistance line. This line has consistently limited the Shiba Inu price growth since its peak of $0.000088 in late 2021. This trendline has acted as a strong barrier, preventing breakouts at multiple key levels.
According to the weekly chart, this resistance line has repeatedly capped attempts at upward movement. It triggered a sharp reversal after SHIB’s decline in 2021 and has since acted as a technical ceiling.
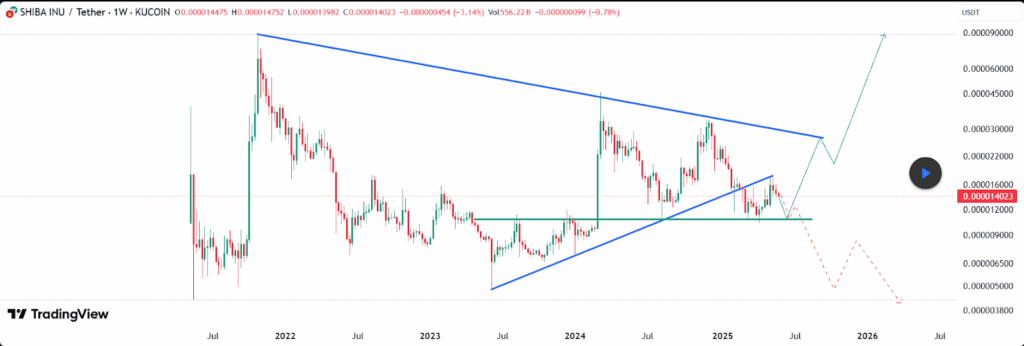
SHIB tested the trendline in March 2024, reaching $0.0000453. It approached the trendline again in December 2024, nearing $0.0000335. Shiba Inu failed to break through in both instances, retreating immediately after contact.
This pattern of rejection reinforces the resistance line’s importance in shaping price behavior. Despite rally attempts, each encounter with the descending line has led to a reversal.
Meanwhile, Salimi notes that the ascending support line formed in mid-2023 has provided several bounce points for SHIB. This support emerged on June 5, 2023, when the Shiba Inu price touched a low of $0.00000483.
The line provided support during price dips in January 2024 at $0.0000071. It held again in August 2024 at $0.0000108, cushioning the downward moves.
Recent Breakdown Below Support Raises Risk Levels
However, recent developments show a shift in structure. In early to mid-2025, SHIB broke below the ascending support, falling back to levels near a key demand zone at $0.0000108.
This zone previously served as support in both August 2024 and April 2025. It is now being retested amid renewed selling pressure. The break below the rising support suggests that bullish strength has weakened significantly.
Shiba Inu price remained below long-term resistance, marking a key phase in its chart structure. It recently broke ascending support, signaling a shift in trend.
According to Salimi, this has prompted two potential outcomes. In the bullish case, if SHIB manages to hold the $0.0000108 level and rebounds, a breakout above the descending resistance could follow.
A successful breakout may open the path toward prior highs, including the all-time peak near $0.000088. This would represent a gain of roughly 571.6% from the current price of around $0.0000134.
Conversely, in the bearish scenario, the failure of the $0.0000108 support could lead to a deeper decline. If support breaks definitively, Shiba Inu price may fall to subsequent levels at $0.000009.
Moving ahead, the token could see a further drop toward $0.000004300. These levels have not been revisited since mid-2023 and represent critical zones of interest if bearish momentum accelerates.
Derivatives Data Confirms Bearish Sentiment Shift for Shiba Inu Price
Beyond price action, derivatives metrics reinforce the bearish outlook. Recent data showed a 20% drop in SHIB trading volume, down to approximately $203.98 Million.
Simultaneously, open interest fell by 14% to $152.88 Million. These declines indicated traders pull back exposure due to risk aversion or anticipation of further downside.
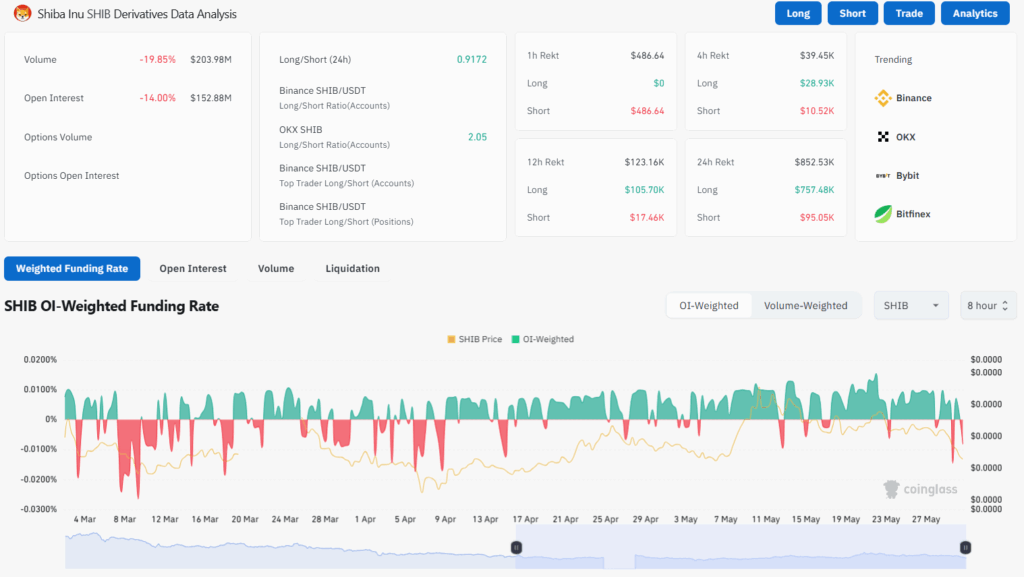
Further insight comes from the long/short ratio, which is 0.9172. This ratio reflects more short positions than long ones, showing that traders are tilting toward bearish bets. The shift aligns with broader caution seen in the market.
Additionally, liquidation figures reveal pressure on bullish positions. In the last 24 hours, over $852,000 in SHIB positions were liquidated, with more than $750,000 coming from long positions alone.
Many traders anticipated a rise in Shiba Inu price but were caught off guard. As SHIB dropped, they faced forced exits, highlighting the market imbalance.
While liquidations were smaller over shorter timeframes, the damage appeared concentrated in major price shifts during the day. The open interest-weighted funding rate also indicates a growing bias toward short positions.
Recent fluctuations have leaned toward negative territory, indicating that traders are increasingly paying to maintain shorts. This trend supports the broader narrative of cautious sentiment and aligns with the price drop observed.