
 Doge Pepe
 Optimism
 Pearl
Pearl Quantus
 Bitway
 Pons
Pons NEAR Protocol
TRON Network significantly advanced as the daily number of active addresses hit its highest point. As TRON’s network engagement increases, the TRX price increases.
The rise in user activity on the blockchain showed a good chance for crypto coins to advance. This comes as the ecosystemrecently surpassed Ethereum’s USDT count.
All-Time Highs in Active Address Moving Averages
According to CryptoQuant, the 50-day and 100-day simple moving averages (SMAs) for daily active addresses have achieved records. In June, the 50-day SMA crossed above 2.4 million active addresses, and the 100-day SMA did so for the first time.
Around mid-2020, moving averages started to grow more. Since late 2023, the speed of increase has picked up. The active addresses spanned a 50-day line between 1.8 million and 2.2 million during that period. There has been a steady rise lately, with the highest bitcoin levels recorded.
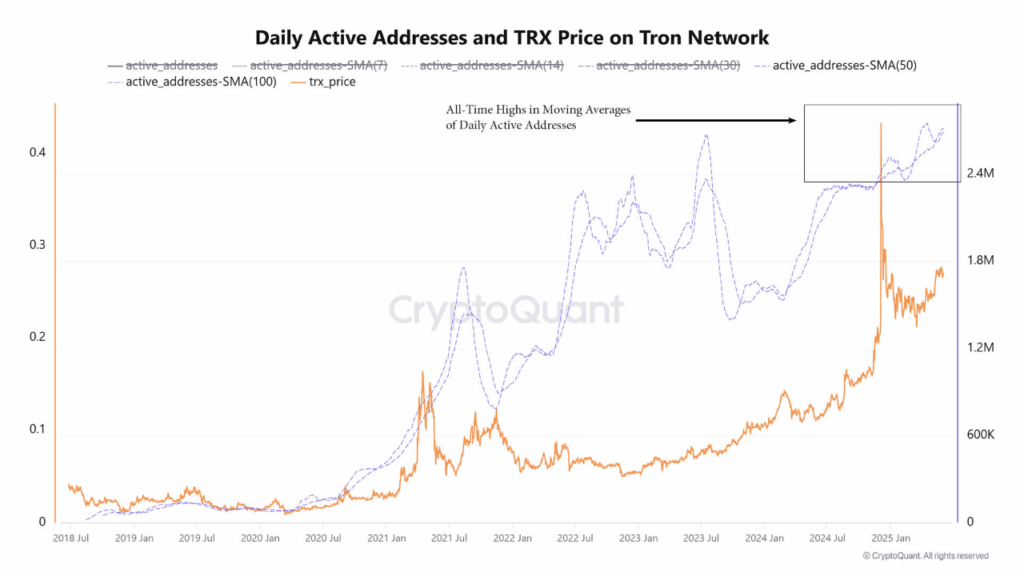
Shorter SMAs, like 7-day, 14-day, and 30-day, have mirrored the trend of longer SMAs. In mid-2024, the 30-day SMA surged past the 2.3 million mark. This steady rise highlights consistent user activity on TRON. The continued growth reflects increasing engagement with the platform.
Also, the 7-day and 14-day SMAs, which have more wild swings, have recently exceeded 2.2 million active addresses. This demonstrates that activity on the network stays high.
TRON’s active address count has often shown changes in market feelings before any major shift. CryptoQuant’s long-form chart shows a surge in active addresses in January and July 2021. These increases came before significant price jumps in the market.
Daily active addresses soared above 1.5 million in January 2021. TRX price climbed from around $0.03 to $0.15 by April 2021. In mid-2021, the same pattern arose as the active address SMAs crossed over 1.8 million. The rise afterwards pushed TRON up to $0.17.
In early 2022, the 50-day SMA of active addresses dropped below 1.3 million. This led TRX into a prolonged phase of trading under $0.10.
The asset began going up after on-chain usage reached 1.6 million active addresses. TRON’s 50-day and 100-day Simple Moving Averages have risen above 2.4 million. This marks its most significant surge in on-chain activity so far.
TRX Price Movement Aligns with Elevated Address Activity
At this time, high levels of on-chain activity paired with rising prices connected on-chain activity with price action. CoinMarketCap data shows that the TRX price was $0.2706 as of press time. This is a 0.69% increase over 24 hours.
This follows a profitable previous month for TRON, which saw investors rake in notable profits. The trading volume stood at $408.27 Million. This was 9.96% less than the day before.
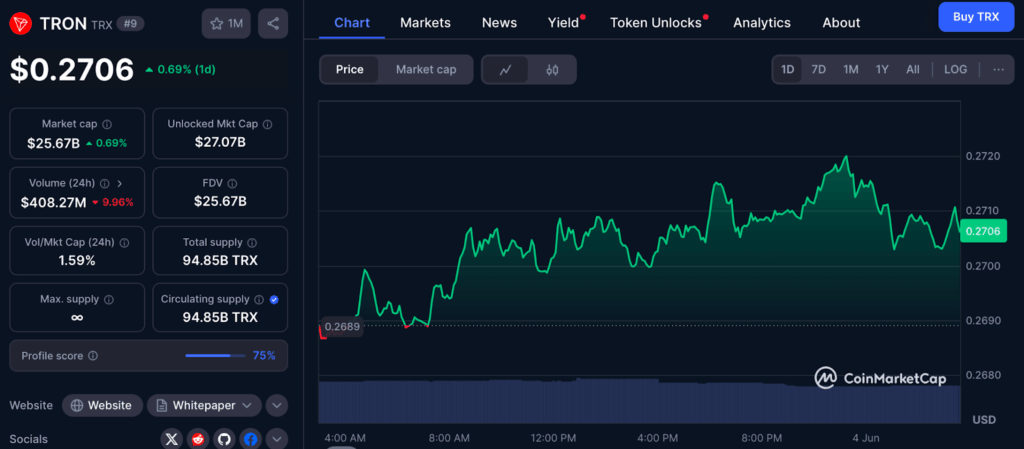
Between May 25 and June 4, the TRX price showed an upward trend. It reached new highs and lows during this period. The upper trend line joining the successive peaks reaches the point of the lower trend line emerging from nearby lows.
The resulting wedge formation usually reflects that the strength of buying activity may be slowing down. On June 4, the wedge’s highest point was close to $0.2705 when the price was around that mark.
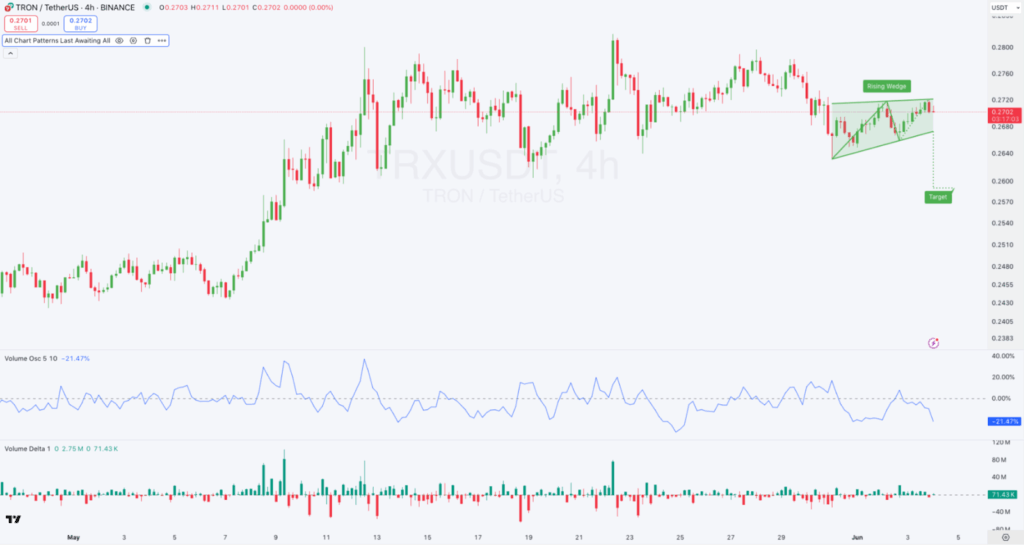
Lower volumes help strengthen the argument that the market is losing momentum. The volume oscillator shows a negative reading of -21.47%. This indicates that buying has slowed relative to selling in the same timeframe.
During price increases, volume delta bars often showed negative values. This indicates that sellers dominated when prices neared the wedge’s peak.
The selling pressure kept prices from breaking higher. Until there is excellent volume to cross over the upper trendline, TRON could have difficulty going above $0.272.





