
 Puffer
 ZKsync
 Pearl
Pearl Bitcoin
 Ondo
Ondo Walrus
 Pudgy Penguins

Key Insights:
- Solana price nears a key breakout point, targeting $300.
- Rising active addresses signal growing network activity and bullish potential.
- Technical indicators support a possible price surge toward $300.
Solana ($SOL) approached a breakout zone after trading inside a falling wedge for months. The pattern, paired with on-chain metrics and rising engagement, suggested that the token could soon test higher price levels.
The token last traded at $145.71 as of June 24, 2025. Analysts observed that $155 marked a breakout trigger, with an upward move potentially sending $SOL toward the $300 mark.
Falling Wedge Pattern Aims for $300 Breakout
The price action of Solana formed a classic falling wedge, a bullish reversal formation defined by lower highs and lower lows. Price approached the narrowing top resistance of the wedge, indicating a potential breakout above the trendline.
Solana rebounded off key support levels several times within the wedge. If it breaks above the $155 resistance, the projected move could extend to $300, based on the measured height of the pattern.
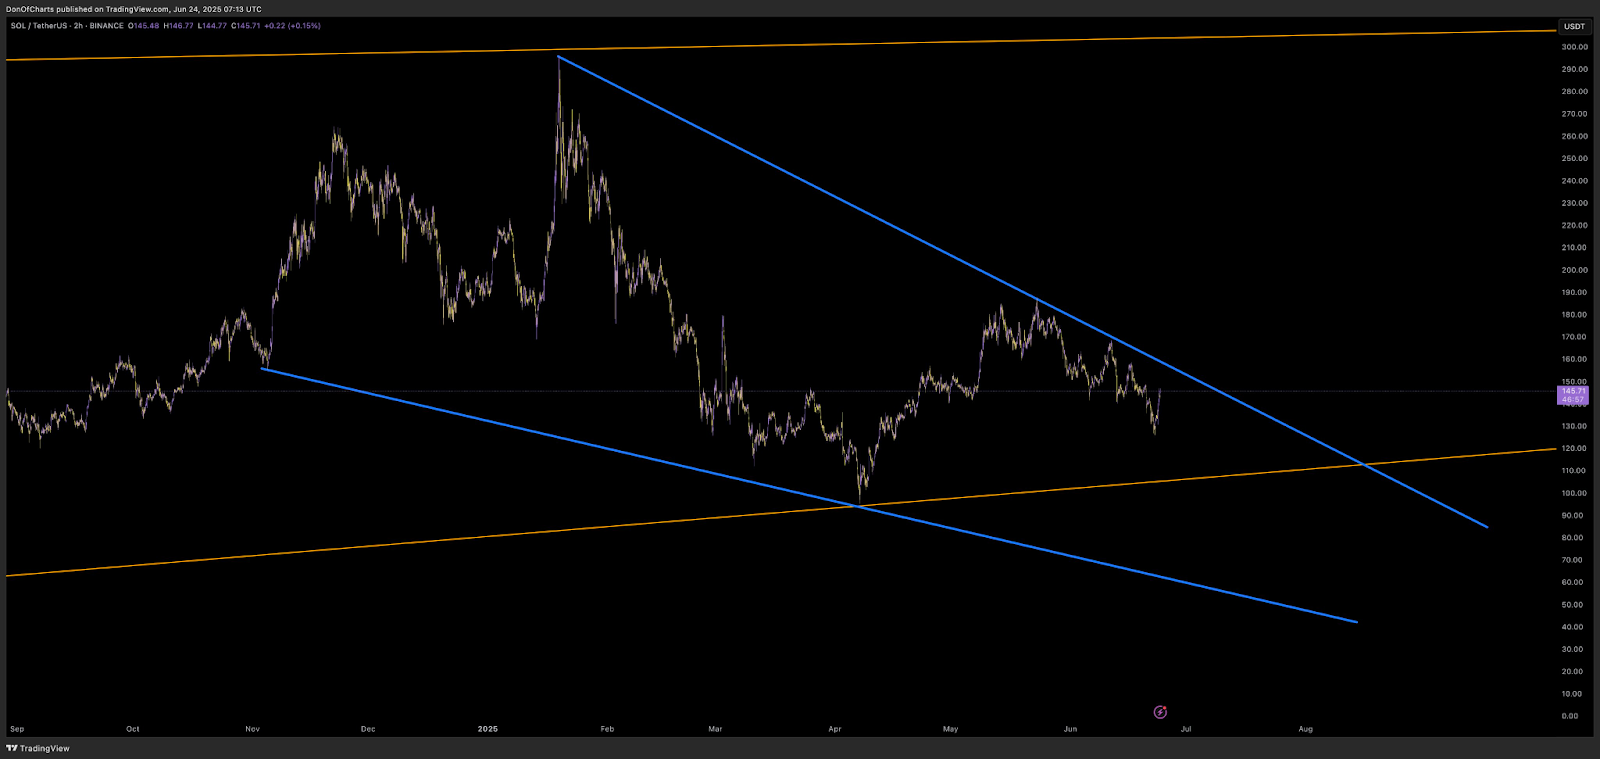
The price has already had some strength and has rebounded on crucial support areas of the wedge. The measured move of the pattern implies that once the breakout occurs, Solana may experience a large increase to the price level of $300. This is coherent with the overall bullish mood on the market.
Surge in Daily Active Addresses Signaling Bullish Potential for Solana
The active number of addresses is also another major driving force behind Solana as it rallies towards the bullish side. In the course of the last several months, the daily active addresses have also increased quite significantly, indicating increased network usage and interest in the network.
The numbers indicate that the number of active addresses of Solana has been staying solidly above 4 million daily users. This is with the sum going to 6 million maximum, as outlined in the chart of metrics attached.
The increase in the number of active addresses adds further proof of the bullish potential as the market goes into the breakout phase. This indicates a strong demand for the network of Solana.
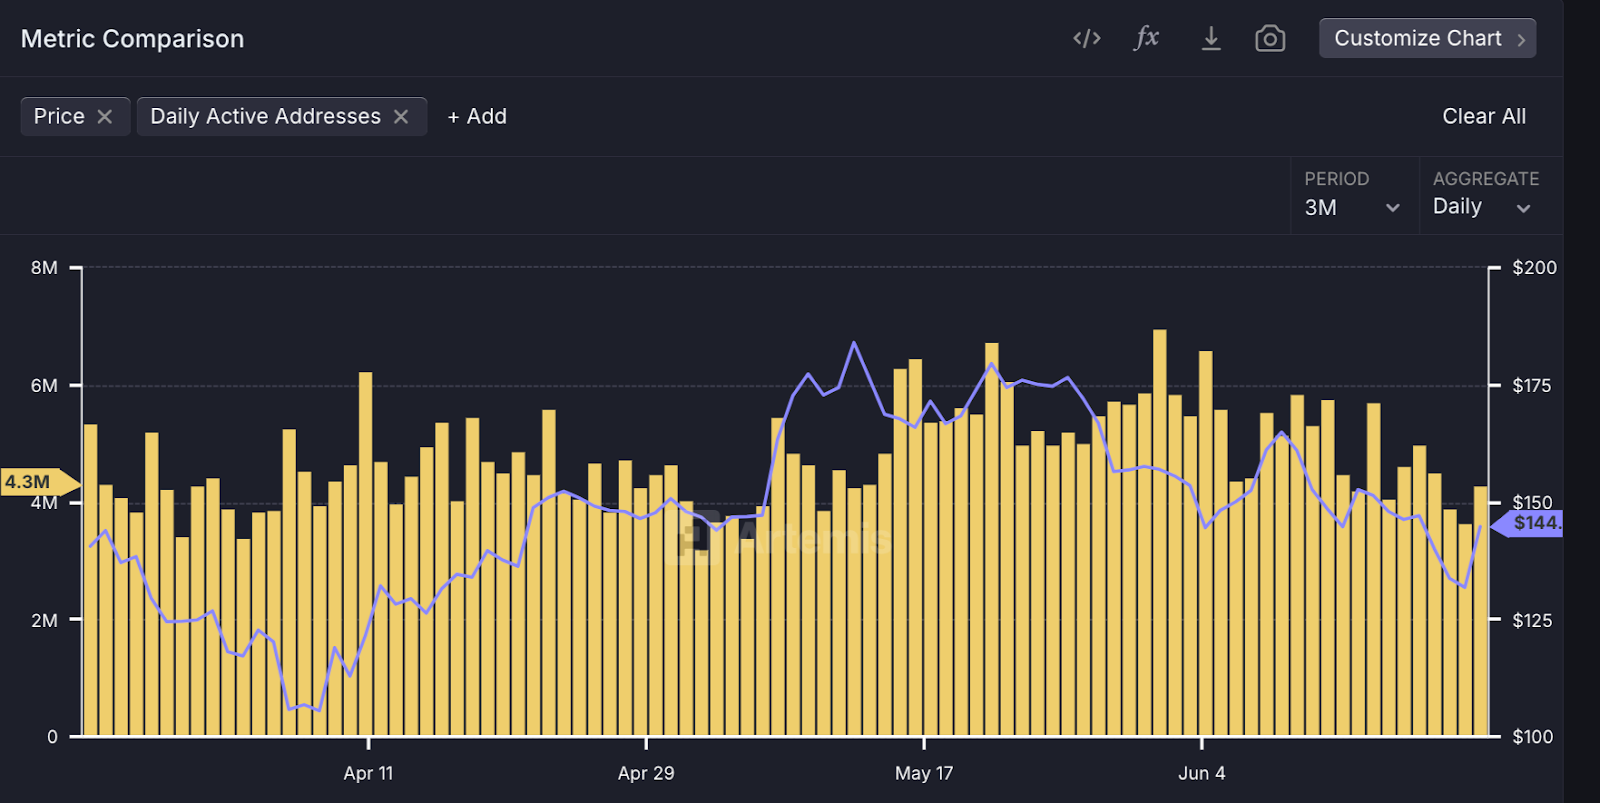
The active addresses chart also indicates that it has been the historical trend of Solanas price to move the same way with the increase in daily addresses activity. It might mean that a breakout near the upper end of the wedge may be accompanied by additional rises in on-chain activity with the possibility of the price reaching the target of $300.
Solana Price Head and Shoulders Pattern Suggests Strong Bullish Potential
Daily Solana ($SOL) charts show a traditional Head and Shoulders pattern. The pattern is a reversal pattern that can be used to identify when the market sentiment changes. At the moment, the right shoulder is forming, and the price has become supported somewhere at the level of $140.
Provided that the pattern will break out above the neckline (approximately at $146), Solana may reach a new high of over $280. This projects a possible 90% gain above its current prices. It is obtained by taking the height of the head to the neckline and transferring upwards to the breakout.
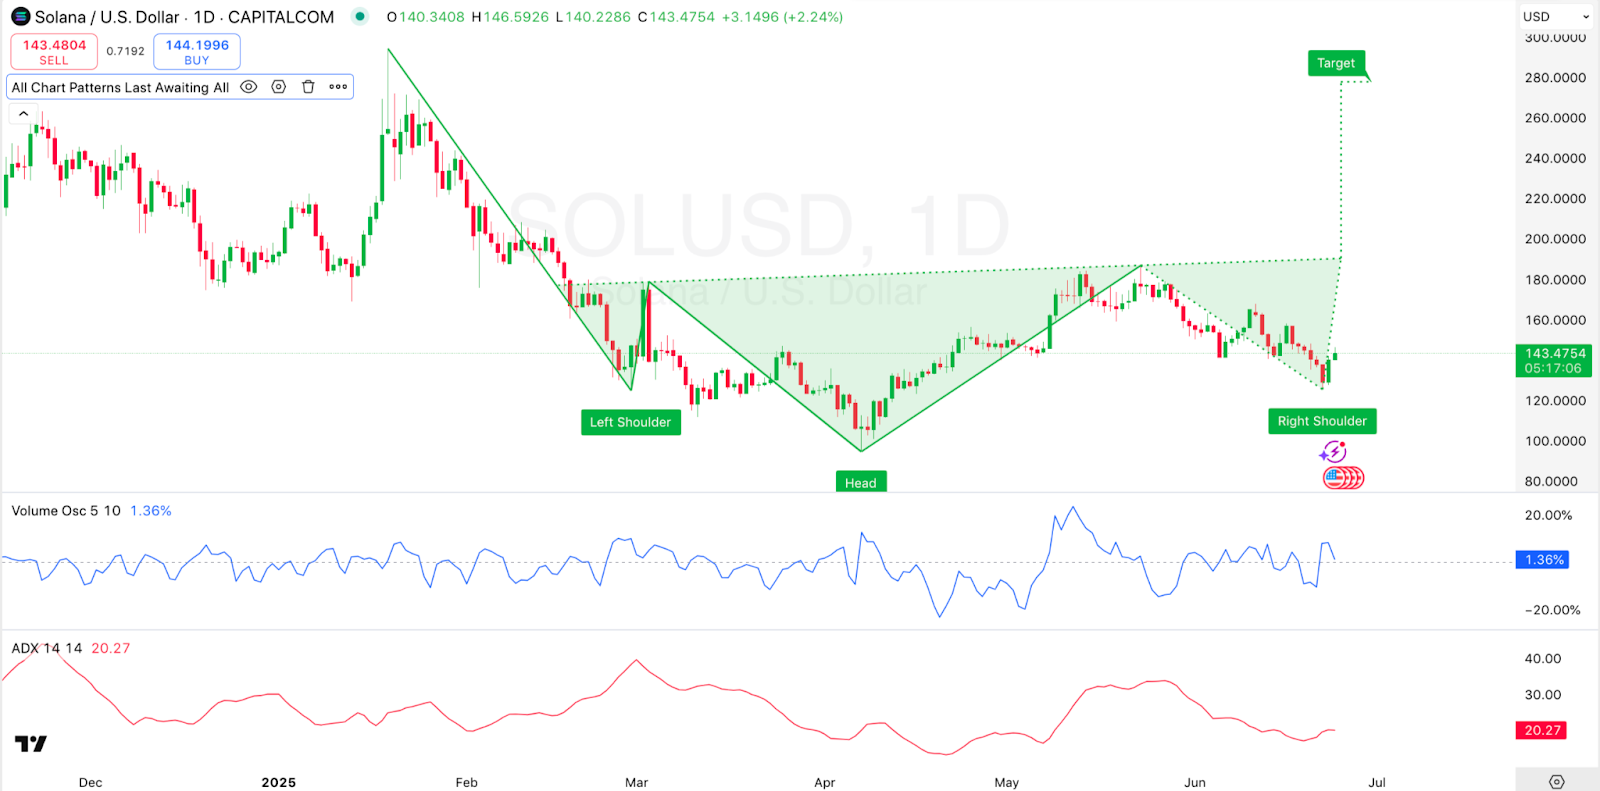
Technical indicators indicate that the ADX (Average Directional Index) is 20.27 and this provides that there is an increasing trend. However, more momentum is open before a clear direction change is attained. The reading of the Volume Oscillator is currently at the low level of 1.36% which is a good sign that there is no breakout yet.
However, with a great deal of change in volume, the breakout can be verified. When the right shoulder finishes, one should expect a price action confirmation with these indicators which may hint on bullish continuation to the target zone.
Disclaimer
This article is for informational purposes only and provides no financial, investment, or other advice. The author or any people mentioned in this article are not responsible for any financial loss that may occur from investing in or trading. Please do your research before making any financial decisions.



