
 Bitcoin
 Pearl
Pearl Starknet
 Zerebro
 NEAR Protocol
 Solana
 Quantus

Key Insights:
- Solana price defends $144 support as on-chain metrics show bullish accumulation trends.
- Institutional interest rises, with Sol Strategies and Classover targeting large SOL treasuries.
- Analysts expect a move toward $152–$161 if support holds; otherwise, a dip to $136 is possible.
Solana (SOL) price is at a critical juncture after defending the $144 support level for several consecutive sessions. Despite broader market weakness, SOL has demonstrated resilience, buoyed by strong on-chain accumulation trends and institutional interest.
Analysts believe that the $144-148 area is a launch pad to potential $161 as long as it holds, and some traders are watching to see lower entry points with bids in the low $120s.
Solana Price Faces Key Decision at $144
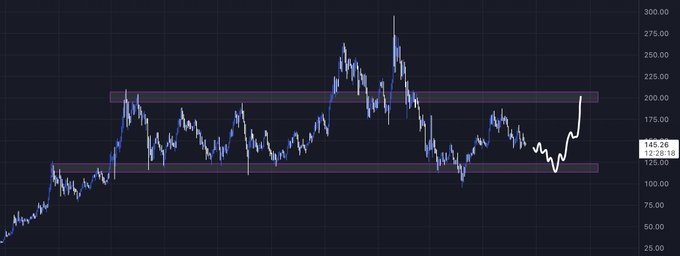
According to analyst 0xBossman, Solana price action remains in a consolidation phase between long-standing support around $125 and resistance near $200. He indicated that if the asset returns to the $120s, it would trigger “max bidding” due to the favorable risk-reward ratio. The chart suggested a potential double-bottom formation, with a sharp upside reversal forecasted when it retests the lower range.
This view aligns with recent short-term price action showing SOL price respecting the $144–$146 support band as outlined by TheDefiGuru. A clean bounce off of this area has the potential to provide a bullish retest of the resistance at $152 and $161.
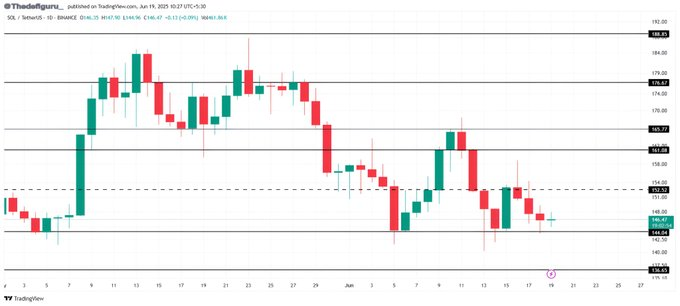
However, failure to hold above $144 risks invalidating the structure and pushing SOL price toward $136 or lower.
On-Chain Data Confirms Holders Are Accumulating
Blockchain analyst TheDefiGuru gave a multi-part update, noting that on-chain trends underlie Solana price strength. The analysis showed that the difference between exchange net position had been net positive in the past three months. It means that the withdrawal of SOL on exchanges exceeds the deposit, which is one of the signs of accumulation.
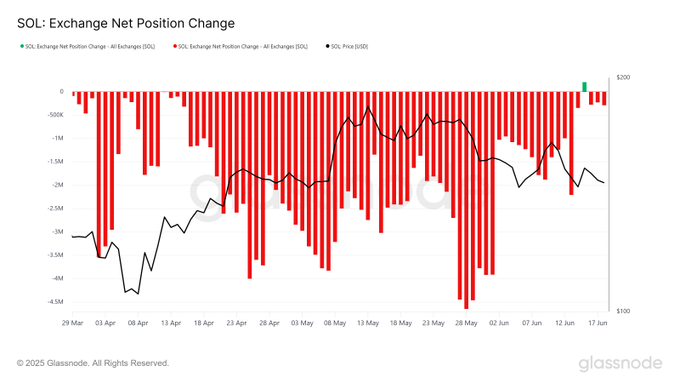
Even during high volatility periods, holders are not selling. The data represents the shift like the market where the speculative sellers have been replaced by conviction-based buyers. This concentration, although the resistance rejection took place in June, provides an enormous technical basis for the possibility of price rally.
The NVT (Network Value to Transactions) ratio for Solana is also declining. This metric meant that the number of transactions per month is increasing faster than market capitalization.
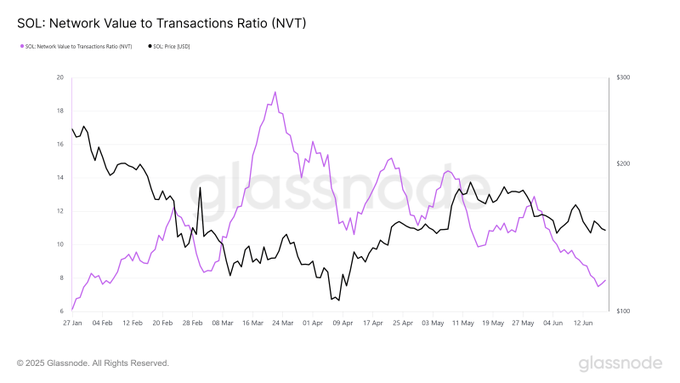
Therefore, this is a bullish indicator that suggests the network is being used more actively compared to its valuation.
Institutional Demand for Solana Grows
Institutional interest in Solana has accelerated with recent regulatory filings. Sol Strategies, a Canadian firm holding 420,000 SOL (valued at around $63 million), filed with the U.S. Securities and Exchange Commission to list its stock on Nasdaq under the ticker STKE. This company has already raised funding of $500 million in the form of convertible notes and intends to issue 1 billion worth of HOLD stocks to increase the company’s SOL holdings.
Analysts believe this mirrors MicroStrategy’s playbook with Bitcoin. Sol Strategies will see to it that it uses public equity and bonds with the aim of continually adding Solana reserves. The company’s Nasdaq ambition could open up broader investor exposure to Solana-linked equity.
In parallel, Classover Holdings, a Nasdaq-listed education firm, also disclosed plans to raise $500 million for a dedicated Solana Treasury. Meanwhile, Hong Kong’s MemeStrategy acquired 2,440 SOL, marking the first such treasury strategy from a publicly traded Asian firm.
Derivatives Market Signals Strong Bullish Positioning
Alongside on-chain and corporate accumulation, derivatives data further supports a bullish case for Solana price. According to Coinglass data, the open interest has increased to $6.86 billion and the options open interest increased by 8.06% to $6.12 million.
This signals increasing speculative activity with a bullish tilt. The total trading volume has dropped by 25.22%, but the fact that the open interest has increased shows that traders are holding on to their positions.
The Binance long/short ratio is extremely biased on the long side, with ratios of 3.17 in retail accounts and 2.83 in the top trader accounts. On OKX, similar ratios are observed where the long/short ratio is 3.36. These indicators show that traders are mostly set towards an upward Solana price breakout.
Disclaimer
This article is for informational purposes only and provides no financial, investment, or other advice. The author or any people mentioned in this article are not responsible for any financial loss that may occur from investing in or trading. Please do your research before making any financial decisions.




