
 streamoors
 IGNITION
 Injective
 Aerodrome Finance
 ZKsync
 Collector Crypt
 Sui
Sui

Key Insights:
- Solana price flashed a TD Sequential buy signal on the daily chart after a steep drop below $150.
- Tight Bollinger Bands Signal Solana Price Imminent Move.
- Derivatives volume rose 65.11% while short liquidations hit $50.62M, indicating a strong short squeeze.
Solana (SOL) displayed signs of a short-term bottom after dropping sharply under the $150 mark. The move triggered a TD Sequential “buy” signal on the daily chart, suggesting a possible trend reversal. Simultaneously, derivatives data and Bollinger Bands indicated that a volatile breakout could follow the recent sell-off.
TD Sequential Buy Signal Appears After Solana Price Dropped Below $150
Analyst Ali Martinez noted that Solana price daily chart has produced a TD Sequential “buy” signal, which often precedes a possible trend change. SOL slid below $150, reached a low of $140, and bounced back afterwards.
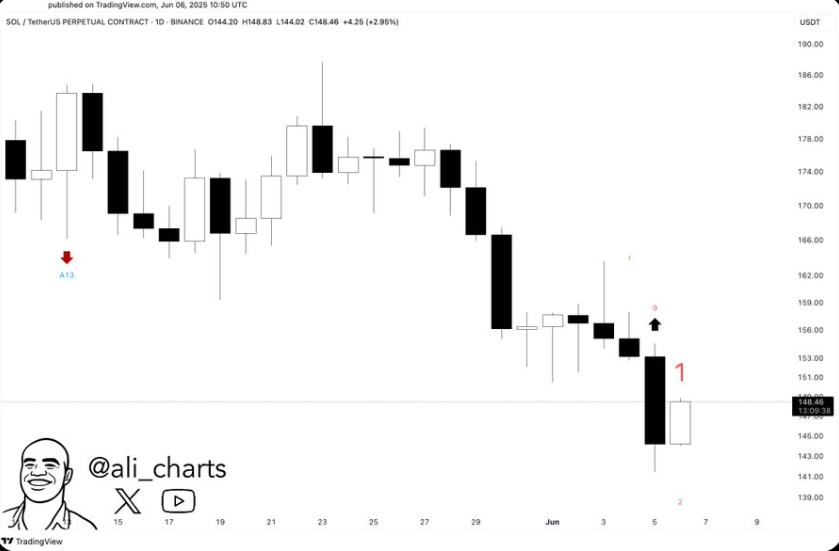
Notably, the TD Sequential is commonly applied to predict when a trend may end and a reversal might appear. When a “1” buy setup is seen during a downtrend, it may mean early support for the price is forming.
In addition, the chart showed a distinct pattern of lower highs and lower lows, with recent sessions capturing a sharp sell-off. However, after registering this indicator on June 5, Solana formed a bullish daily candle, suggesting a possible shift in sentiment.
Consequently, the upward reaction followed a lower wick formation, indicating buying activity during the session. Solana price has since stabilized around $148, suggesting a pause in bearish momentum.
Tight Bollinger Bands Signal Solana Price Move
More so, Solana price monthly chart revealed extremely tight Bollinger Bands, suggesting a major move is imminent. The altcoin price currently hovers near the baseline at $150, acting as a crucial pivot. Holding above it supports a bullish bias and potential move toward $200. Compression signals build up before likely volatility expansion.
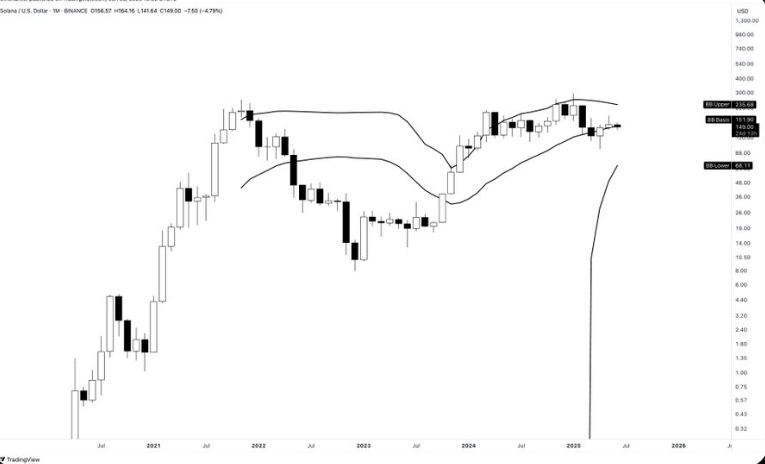
However, a break below the basis line would signal a bearish shift, possibly targeting the lower band around $48. The price has consolidated after a strong recovery, indicating indecision. Maintaining support at the baseline keeps bullish momentum intact, while a breakdown could confirm weakening strength and open doors to further downside.
Derivatives Metrics Signal Short Squeeze Activity
In the derivatives market, Solana experienced a 65.11% surge in trading volume, reaching $17.17 billion. This jump reflects heightened market participation, particularly during volatile sessions.
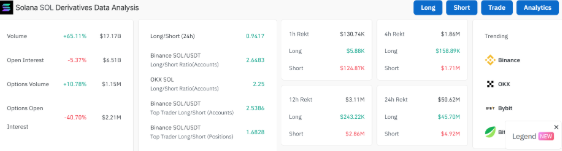
At the same time, total open interest decreased by 5.37%, falling to $6.51 billion. This suggests that while trading increased, some participants closed positions during the price fluctuation.
Liquidation data over the past 24 hours showed short traders absorbed the majority of losses. Approximately $50.62 million in short positions were liquidated, compared to $4.92 million in long positions.
Subsequently, the disproportionate liquidation of short trades signals a possible short squeeze event. When prices rebound quickly, short sellers can be forced to cover positions, leading to further buying pressure. This market behavior often occurs when bearish sentiment is overextended.
Long Position Bias Strengthens Across Exchanges
Account-based long/short ratios from major trading platforms support a growing bullish sentiment. On Binance, the long/short ratio stands at 2.6483, indicating that nearly three times more accounts are holding long positions compared to shorts.
Similarly, OKX reports a long/short ratio of 2.25, pointing to a similar skew in favor of longs. These figures suggest a directional leaning toward buying activity among retail and institutional traders.
Further analysis of top trader trend on Binance shows the long/short ratio for key accounts is at 2.5386. Additionally, the long/short ratio based on positions sits at 1.6828.
Hence, these ratios reflect that top traders are holding a larger proportion of long trades, both by number of accounts and by open contract positions. This trend typically indicates growing confidence in a potential Solana price upward move.
Disclaimer
In this article, the views and opinions stated by the author or any people named are for informational purposes only. And they don’t establish the investment, financial, or any other advice. Trading or investing in cryptocurrency assets comes with a risk of financial loss.




