
 Bitcoin
 Pearl
Pearl Starknet
 Zerebro
 NEAR Protocol
 Solana
 Quantus

Key Insights:
- Solana price remains at $139 within a 3-day demand chain, signaling accumulation.
- Bullish divergence and stochastic golden cross support upside continuation.
- Fifth wave projection targets $160+ if $139 support remains intact.
Solana price is holding firm above $139, a crucial zone identified as a 3-day demand chain on the macro chart. Analysts believe that if this level remains intact, SOL price could rally toward $160 and eventually retest the $180–$200 region.
Solana Price Anchored in 3-Day Demand Chain Zone
Wyckoff Insider highlighted that Solana‘s macro structure continues to develop inside a 3-day demand chain. This area, lying approximately between $130 and $144, has been a very good accumulation point where purchasers once triggered a price rally. It has been a zone of critical support as the price has bounced off this area.
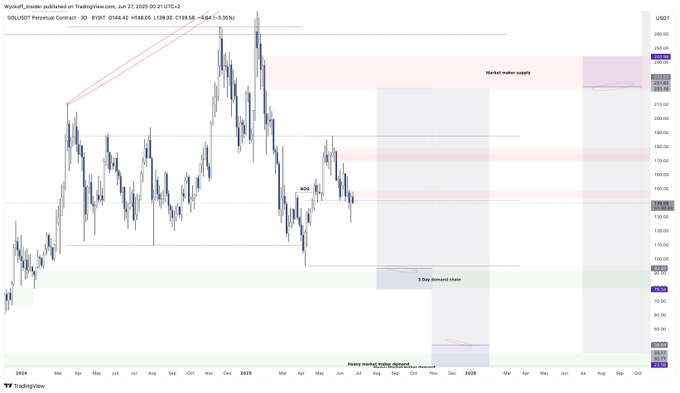
Another response in this region of demand is the current price of about $143. Market structure has already shown a bullish break of structure (BOS), which confirms that higher lows are forming. This move reinforces the level of support and dials back the chance of lower fallout unless the zone breaks.
Nevertheless, should price honor this demand chain into the next few daily closes, the next possible logical resistance trades near $160. The historical significance of $139-$144 range is further highlighted by the fact that it used to coincide with institutional activity and market-maker interest.
Bullish Divergence and Golden Cross Support Reversal
CryptoBatman also noted powerful signs on the 3-day chart, namely a bull indicator between the price and stochastic momentum, as well as a recent golden cross on the stochastic indicator.
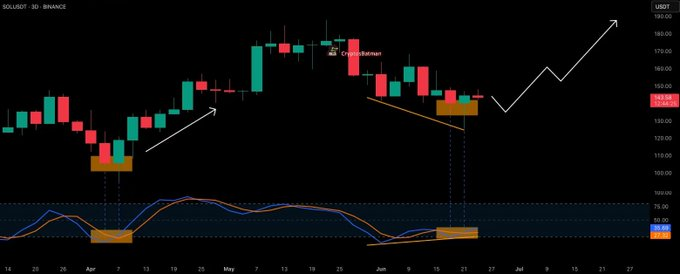
Historically, such a setup has led to substantial upside in Solana price, as seen in April and January. Stochastic cross, with selling volumes decreasing, has proved to be accurate in detecting early reversals.
The price in the present structure has ceased to form new lows, and the stochastic oscillator has pulled up out of oversold territory. This price-momentum dispersion typically precedes breakout patterns.
The targeted direction by CryptoBatman indicates a retest of the $160 level and subsequent consolidation to the area between $180 and $200. These levels coincide with previous resistance zones and the start of market-maker supply regions.
Elliott Wave Count Targets Wave-(5) Extension Above $160
Meanwhile, Man of Bitcoin provided an Elliott Wave-based structure indicating that Solana recent pullback is corrective rather than impulsive. According to his chart, the current movement from $129 to $146 appears to complete wave (4), positioning price for a wave (5) rally as long as support above $139 holds.
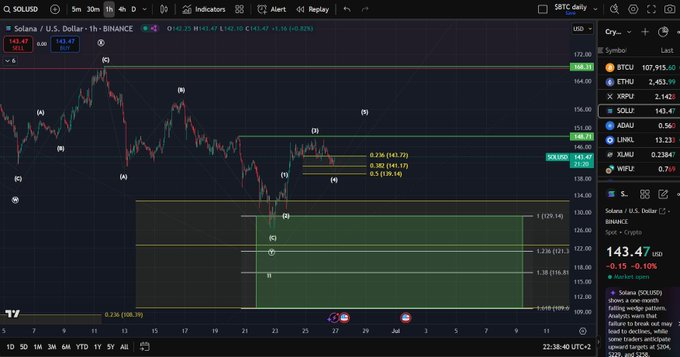
The corrective wave-(4) is currently retesting the Fibonacci retracement zone between $141 and $139.14. This is a technical area that functions as a bounce area in normal, healthy uptrends. Potential fifth wave implies the further break above $160 as long as the count proves to be correct and as long as the support at the level of $139 is not violated.
If SOL price fails to hold above $139, the wave count would likely be invalidated, and a deeper correction toward the $120–$129 area could unfold. However, the recent price action exhibits support above this level, and so, the wave count remains intact so far.
Long/Short Ratio Spikes as Bulls Regain Momentum
The SOL long/short ratio has also jumped up very aggressively and has gone up above 1.10 on the 4-hour pairing. Based on Coinglass data, this represents the first significant flip to the long side following an extended period of bearish-to-neutral positioning. The spike indicates that traders are gaining confidence in the upward price movement and setting themselves accordingly before a possible breakout.
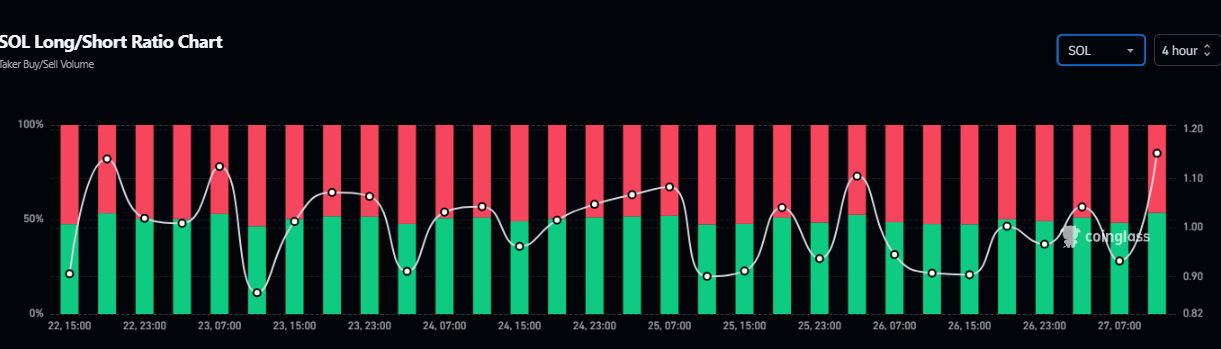
Performance was in the range of 0.90 to 1.00 since June 25, indicating zero to mixed sentiment. The latest green bar and slope, however, indicate a trend that long takers are coming to the lead, whereas bullish volume is rising drastically. In the past, a convincingly bullish cross above 1.05 can be seen, followed by a continued upside.
Disclaimer
This article is for informational purposes only and provides no financial, investment, or other advice. The author or any people mentioned in this article are not responsible for any financial loss that may occur from investing in or trading. Please do your research before making any financial decisions.




