
 no crying in the casino
 NEAR Protocol
 Starknet
 Pyth Network
 Pearl
Pearl Quantus
 Pudgy Penguins

Key Insights:
- Bonk price surges 10%, breaking resistance at $000018.
- Trendline breakout confirms bullish momentum on the daily timeframe.
- 24h trading volume up 30%, signaling strong buyer interest.
Bonk price has surged over 10% in the last 24 hours. This makes it the top-performing cryptocurrency among the top 100 by market cap.
Trading above $0.000018, BONK’s market capitalization has climbed to $1.48 Billion. On the other hand, daily trading volume soared to $594 Million, marking a 50% jump.
The memecoin has also seen a remarkable 30% gain over the past week. Several catalysts drive this uptrend. This includes growing speculation around a possible 2x leveraged BONK ETF from Tuttle Capital Management.
Although unconfirmed, reports suggest the earliest launch date could be July 16, pending regulatory clearance. BONK, which is nearing one million holders, further strengthened investor sentiment.
At over 943,000 wallets, hitting the one million milestone will initiate a planned burn of 1 trillion BONK tokens. This move is expected to tighten supply and potentially boost prices.
Adding to the bullish momentum is the launch of the first Solana ETF on July 2. This has energized the broader Solana ecosystem. BONK remains a prominent Solana-based asset, so the ecosystem’s strength is drawing more attention to the token.
Bonk Price Surges 30% After Bullish Breakout
Crypto analysts report that the Bonk price has surged by nearly 30%, highlighting a potential breakout from a descending channel. A recent chart analysis shows that the token broke through resistance after a steady downtrend, signaling strong bullish momentum.
The breakout zone was marked with high volume, confirming trader confidence and a shift in market sentiment. The analyst emphasized the importance of identifying such technical patterns early for successful entries.
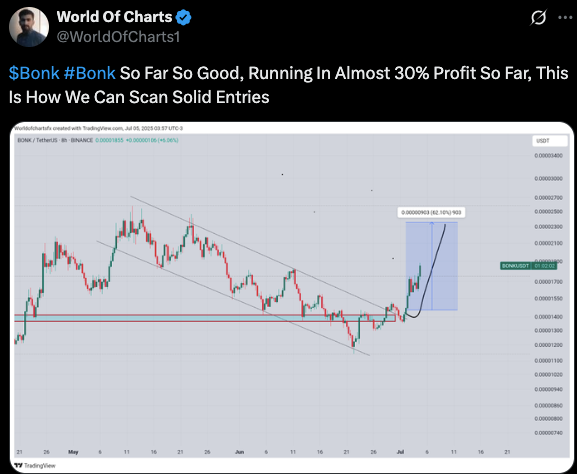
A close look at the chart shows BONK has gained traction after consolidating around a key support level. With this recent movement, the token appears to be establishing a new upward trend. This suggests further price potential in the short term.
Analysts Predict Strong Bullish Momentum Ahead
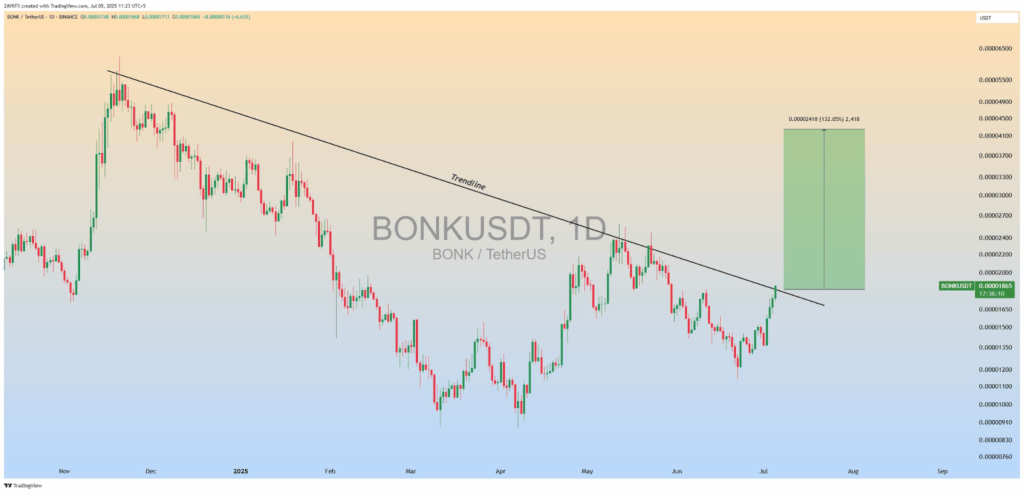
ZAYK Charts’ latest technical analysis highlights that the Bonk price is breaking a declining trend line. This move may signal a shift in price direction.
The breakout is witnessed on a 1-day time frame, which mainly shows a possible change of direction of the market. As per the chart, this trend line has remained a tough resistance for several months.
After confirming this breakout, it predicts a significant bullish movement in BONK. A highlighted price projection zone has also been noted in the chart, which depicts the optimism of a possible rally.
Provided that momentum is up, BONK can experience a sharp rise. It is similar to the patterns of bullish rises observed in the past.
Bonk price has surged by over 10% in the past 24 hours, pushing toward a key resistance zone near $0.00002. This move comes as bullish momentum builds, supported by improving technical indicators on the daily chart.
An upward sloping wedge that formed between the new higher lows and lower highs can be seen. BONK is trading at a rate of about $0.00001842, nearly at the immediate resistance line.
The price can reconfirm at the $0.00002 mark if bulls do not relinquish control. An affirmative break with this may open the doors to the next primary goal, $0.000025.
The Relative Strength Index (RSI) is currently 64.12, slowly rising above the 50 neutral point. According to RSI movement, the bulls have already gathered the pace of movement but are not getting too tired yet.
In the meantime, the MACD has broken into positive territory, indicating that the MACD line is above the signal line. It is regarded as a bullish signal, continuing the upward trend.
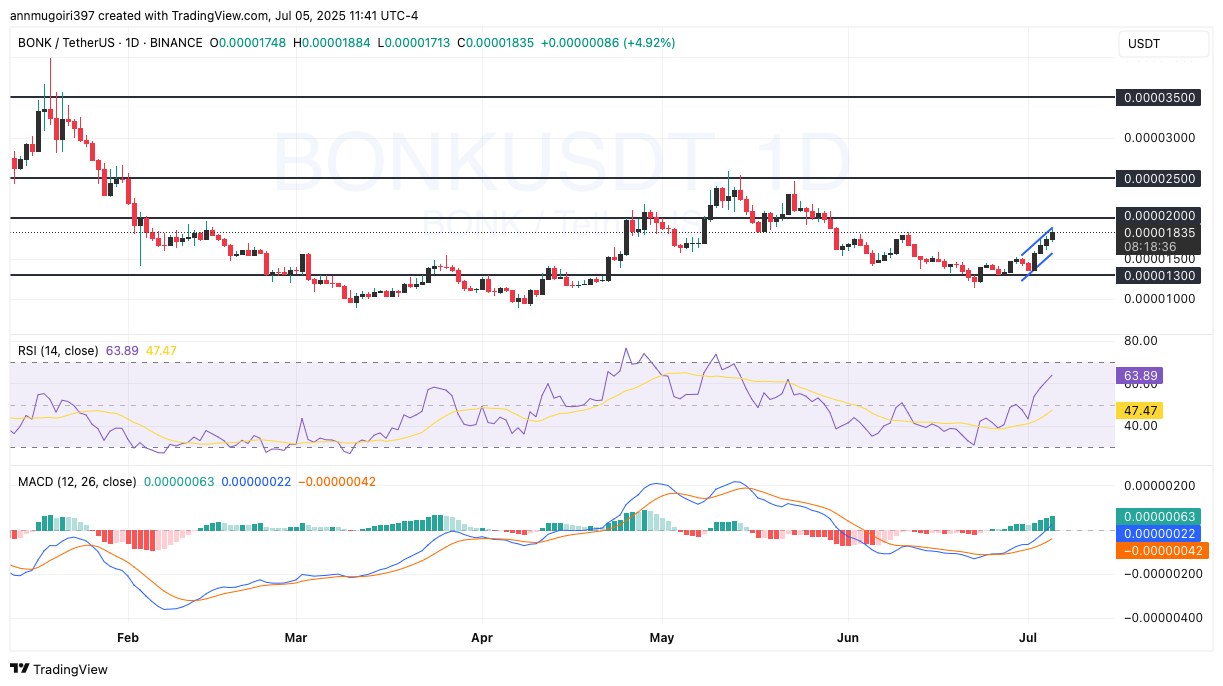
If Bonk price maintains support above the $0.000015 region, traders could anticipate a push toward $0.000025. However, failure to hold above this support could result in a retracement toward $0.000013, a key demand zone.
Disclaimer
This article is for informational purposes only and provides no financial, investment, or other advice. The author or any people mentioned in this article are not responsible for any financial loss that may occur from investing in or trading. Please do your research before making any financial decisions.



