Injective
 Celestia
 streamoors
 Sui
Sui Pudgy Penguins
 Bitcoin
 Pearl
Pearl

Key Insights:
- Bitcoin price hit an all-time high of $123,217, backed by a 3.58% daily gain and $109B in 24-hour volume.
- A whale holds a 3,000 BTC leveraged long, now $33M in profit, signaling conviction.
- A breakout above $118K resistance and bullish indicators point to $125K as the next target.
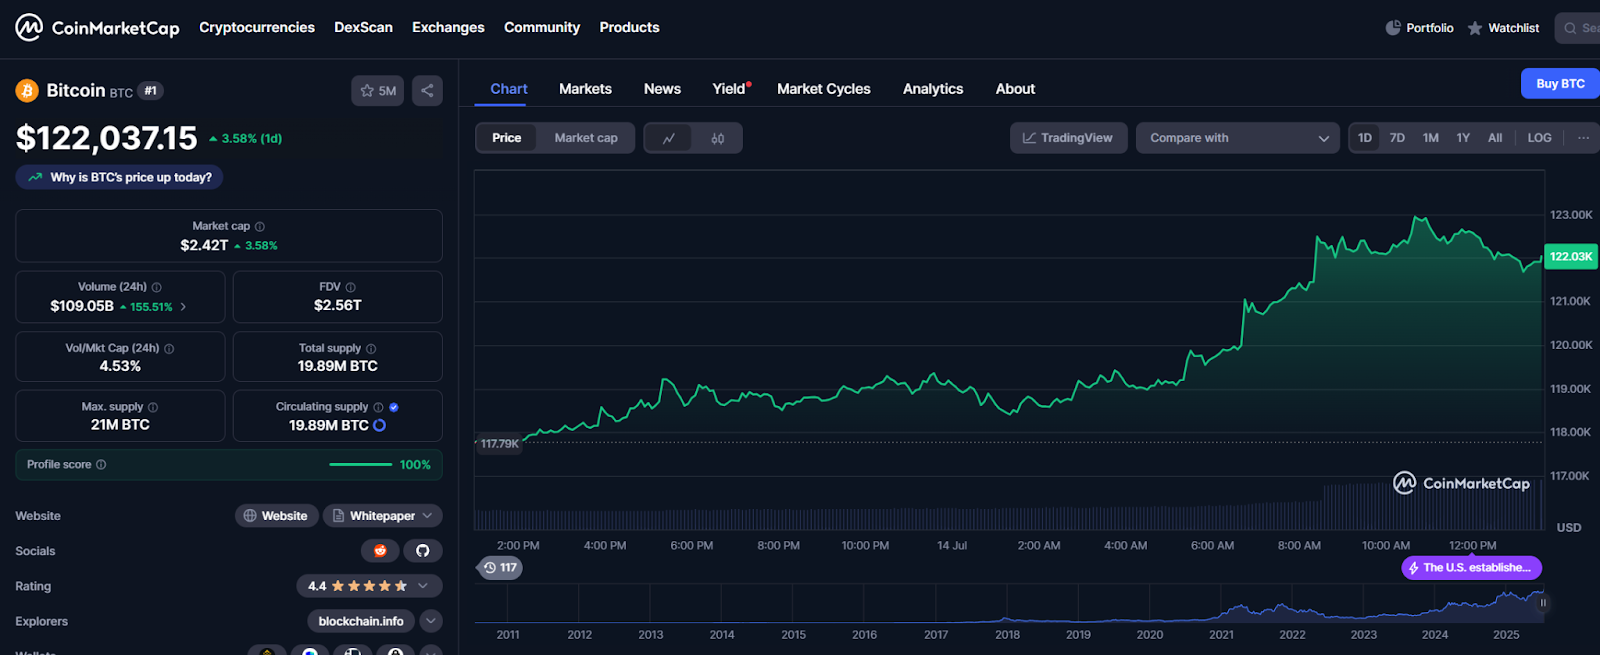
Bitcoin price went over the 120,000 level, setting a new all-time high in the wake of a widespread crypto market rally. BTC was at the highest point of 123,217, and it is followed by a small retracement to 122,003.
Bitcoin Price Crosses Above $122K
CoinMarketCap data shows a 3.58% daily gain to $122,037 as of press time. This thereby elevates Bitcoin to a $109 billion trading volume of trade in 24 hours, a surge of 155.51 %.
The breakout is accompanied by acute bullish pressure on the part of large holders. Recent statistics on trading by Hyperdash show that a whale who owns more than 3,000 BTC, worth over $360 million in the extended position. The entry started when BTC was trading at an average price of $109,000.
It is worth $33 million of unrealized profit as it currently stands at over $120,000. The action has almost reduced a previous drawdown of $35 million, with the total realized losses reduced to a measly $1.4 million.
Leveraged Longs Hold as Market Breakout Confirmed
The PnL chart presented by Hyperdash indicated that the portfolio had a value of a $40 million unrealized loss in June 2025. That drawdown occurred in the long position. However, it has not stopped yet. The Bitcoin price was now at unheard-of levels above $120K.
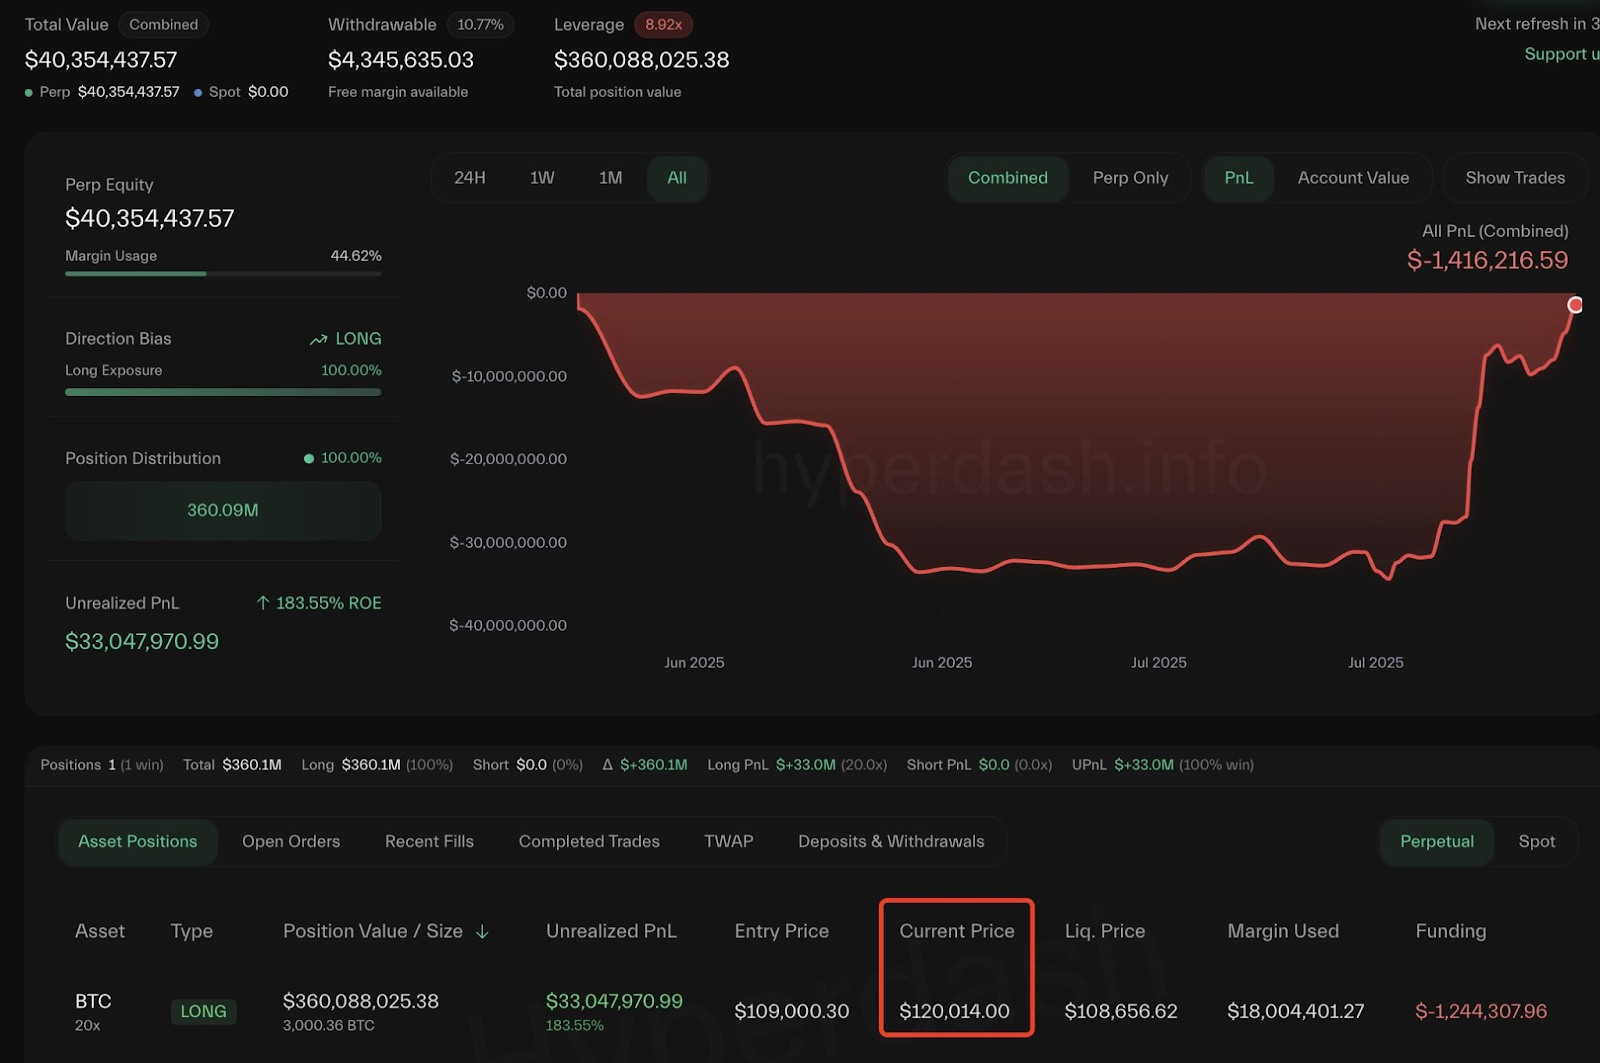
The leverage ratio on the position was about 8.92x, and the liquidation price of the position was $108,656. Such a jump in the price of BTC to $120,014 on the pricing engine of Hyperdash ensures a healthy distance between spot and liquidity prices.
It helps to support the long thesis. The level of margin utilization by the trader is 44.62 %, wherein $18 million was utilized as margin with a total position value of $360 million.
Bitcoin Price Charts Exhibit Bullish Trends
A longer-term trendline that can be identified by looking at the Bitcoin price chart has been breached. It predetermines the emergence of bullish trends rather than consolidation.
The falling trendline that was drawn with reference to past cycle highs is now broken by price. A combination of this breakout, grave volume inflows, and positive trend indicators (+2 signals in the 3-day chart). It leads to the possibility of further buyer control.
Remarkably, the current price of Bitcoin can be seen as a breakout on the earlier resistance range of $117,000-118,000 even. This level has been used as support as well as resistance since late 2024. The clean break test and the confirmation in terms of the retest also support the upward movement.
Another bullish indicator is on-chain positioning by the big players. The whale has a long period going by without being touched even after a draw down period early this quarter.
This action is in contrast with common profit nabbing tendencies, which normally follow vigorous rallies. Rather, it shows confidence in a longer-term target price above 120,000.
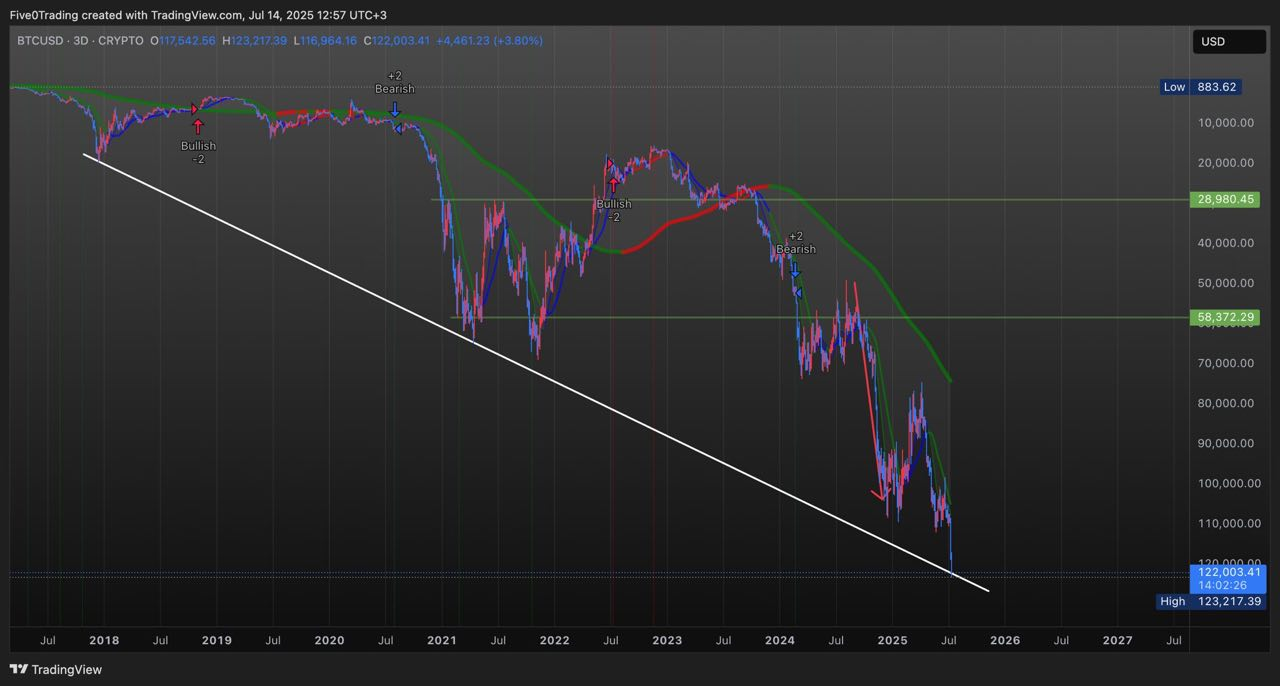
As Bitcoin price accumulates over $120K and maintains higher lows, the next level of such resistance is within $124K and $125K. The CoinMarketCap hourly chart shows steadily increasing buyer momentum, with the Bitcoin price pullbacks swiftly being bought on short-term frames.
Narrow order books above the current prices will also indicate the likelihood of a vacuum being created that will draw the price down to 125K.
Disclaimer
This article is for informational purposes only and provides no financial, investment, or other advice. The author or any people mentioned in this article are not responsible for any financial loss that may occur from investing in or trading. Please do your research before making any financial decisions.