
 NEAR Protocol
 Bitcoin
 Aerodrome Finance
 Pearl
Pearl Uniswap
 Quantus
 Pudgy Penguins
Key Insights
- HBAR crypto appears to be in a make-or-break situation based on its past performance.
- Investors are taking advantage of the current dip and ongoing consolidation, as accumulation surges.
- HBAR could soar by 40% if it closes a daily candle above the $0.26 level; otherwise, it may fall by 13%.
Over the past week, Hedera (HBAR) crypto has shown an impressive price uptick. It broke through multiple hurdles, including the 200 EMA and a key resistance level near the $0.20 mark.
However, the HBAR price has now reached another critical level. There are concerns about a potential price dip based on its past performance.
At press time, HBAR stands at $0.235, recording a modest gain of 1.72% over the past 24 hours. However, due to its past performance and the ongoing correction, trader and investor participation has declined, resulting in a 27% drop in trading volume.
This drop in trading volume, amid the current market structure, suggests reduced downside pressure. It signals a potential price recovery once buying interest returns.
Investor and Trader Sentiment
Investors and long-term holders have begun taking advantage of the price drop, as they appear to be accumulating the token, according to on-chain data from Coinglass.
The on-chain metric Spot Inflow/Outflow reveals that over the past 48 hours, more than $8.48 million worth of HBAR tokens have been withdrawn from exchanges.
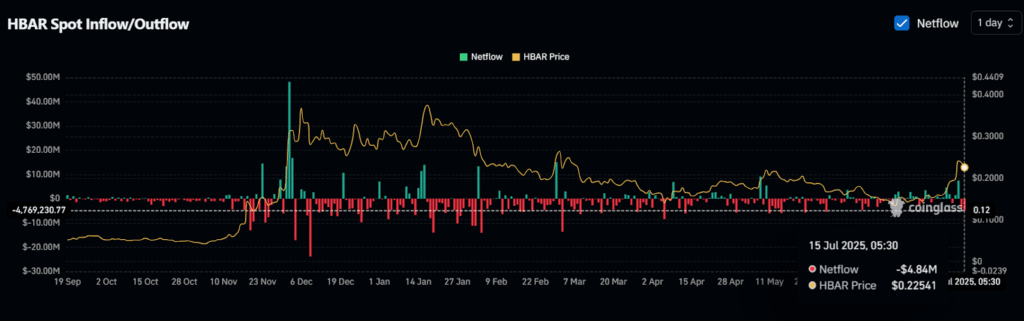
This notable outflow, occurring while the price appears to be struggling, is a sign of potential accumulation and could lead to increased buying pressure and further upside momentum.
Meanwhile, traders appear to have a bearish outlook, as their bets on the downside have increased significantly. Data reveals that the major liquidation levels for HBAR are $0.2292 on the lower side and $0.2379 on the upper side.
At these levels, traders are over-leveraged. Over the past 24 hours, they have built $1.35 million worth of long positions and $4.54 million worth of short positions. Those positions indicate a bearish sentiment among traders in the short term.
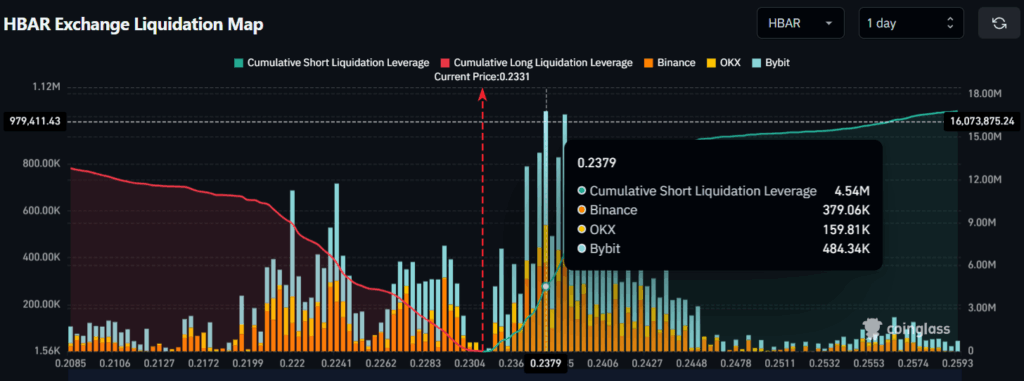
When combining these metrics, the short-term view appears bearish, whereas the long-term outlook remains bullish, as accumulation continues, hinting at HBAR’s strong long-term potential.
HBAR Price Action and Key Levels
According to expert technical analysis, HBAR recently broke out from a key resistance level at $0.20. It is now struggling to break through another critical resistance at $0.26.
The daily chart shows that the last time the asset reached this level, it experienced a massive sell-off. That resulted in a 50% price dip and raised concerns of a potential repeat. However, current market sentiment has shifted into bullish territory. So, the likelihood of a price dip remains low if certain conditions are met.
Based on recent price action and historical patterns, HBAR’s upside momentum may only materialize if the asset closes a daily candle above $0.26. If this occurs, HBAR could potentially surge by 40%, with the price targeting the $0.376 level in the near future.
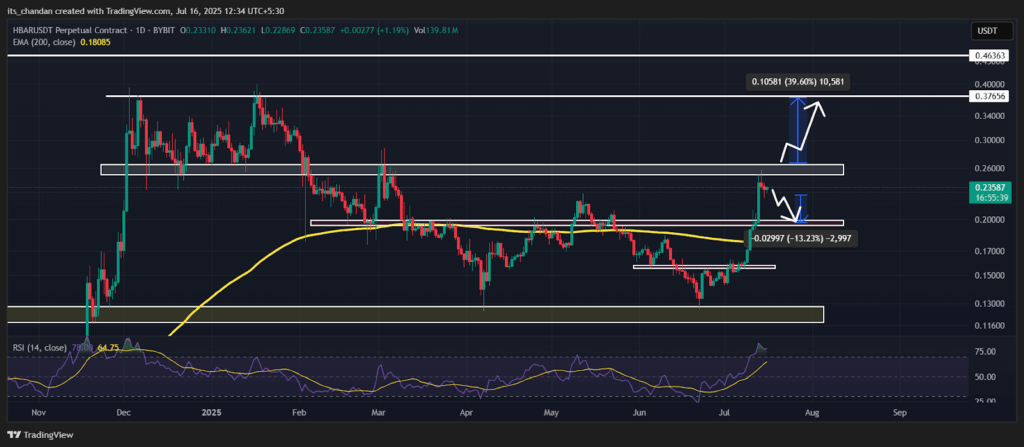
On the other hand, if this momentum fails to sustain, HBAR price could experience a dip of over 13.5%. It could fall back to the $0.20 level.
When writing, HBAR’s Relative Strength Index (RSI) stands at 77, indicating that the asset is currently in the overbought zone. It suggests that buying pressure has been strong in recent sessions, and a short-term pullback or consolidation could be expected.




