
 Bitcoin
 Aerodrome Finance
 Zerebro
 Starknet
 Zama
Zama Pearl
Pearl ZKsync

Key Insights:
- Ondo Price breaks descending triangle, targets $1.60 confirmed breakout.
- The descending triangle breakout flips resistance and confirms bullish trend continuation.
- OGM launch, partnerships, and acquisitions strengthen Ondo’s growth outlook fast.
The Ondo price hovered around $0.9345 on July 16, 2025, as bullish momentum strengthened. ONDO remained inside an ascending channel, indicating a sustained upward trend.
Support held near $0.90, which marked a critical base for recent price action. Resistance stood near the $1.00 psychological barrier, where ONDO consolidated just below.
Ondo Price Breaks Triangle, Eyes $1.60 Target
Crypto analyst Ali tweeted that the Ondo price has officially broken out of a descending triangle pattern on its daily chart. According to the analyst, this breakout was confirmed after the cryptocurrency closed above the $0.87 level.
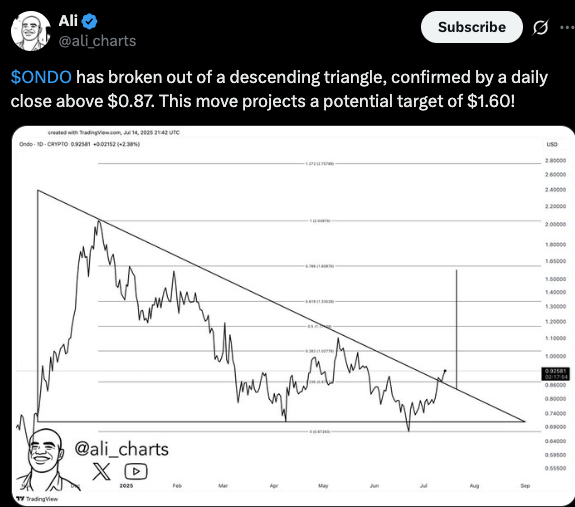
The chart shared in the tweet shows that ONDO had been consolidating within a downward sloping triangle since its previous highs. After a prolonged period of lower highs and steady support, the breakout now signals a possible trend reversal.
Ali suggests that, based on the technical pattern, this move could push ONDO toward a projected price target of $1.60. The price target is derived from the triangle’s height, added to the breakout point.
Technical traders often monitor such chart patterns to anticipate major price movements. A breakout like this can indicate renewed buying interest and momentum in the market.
ONDO has recently surged past a key resistance level, signaling a potential shift in market sentiment. The token now enters what analysts call the “break and retest” phase, a critical stage where previous resistance may turn into new support. This transition often precedes upward momentum if buying interest holds firm.
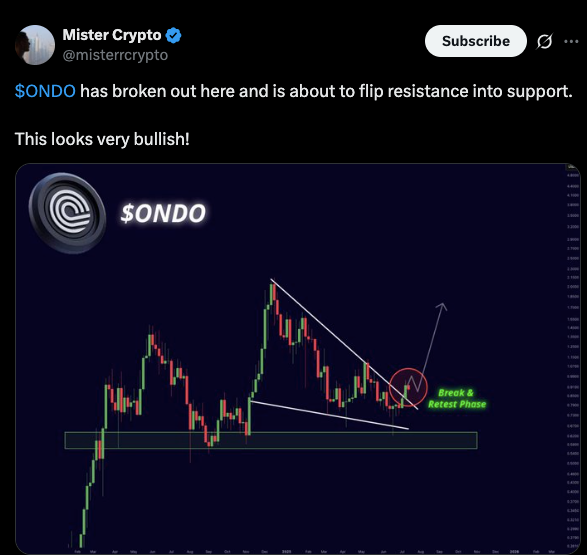
Technical charts show a clean breakout from a descending trendline, reinforcing bullish expectations. The retest of the breakout zone suggests stability as long as the price maintains its current range.
Ondo Price Surges Ahead of Global Markets Launch
Ondo’s price remains on an uptrend despite the prevailing bullish sentiments among investors as the ecosystem continues to develop significantly and move forward to launch its market.
The Ondo Global Markets (OGM) Alliance has unveiled new strategic partnerships almost daily, the latest being BNB Chain. These collaborations are a positive indication of deep support from key players in the blockchain and lead to an increase in the scope of the ecosystem.
Besides the partnerships, the Ondo team has also declared various buy-outs with the intention of supporting its infrastructure and operations. Such gestures strengthen a long-term vision and business scalability of Ondo.
The widely expected opening of Global Markets towards the end of the month is an important reason why the bullish view has emerged. This project will bring real-life assets (RWAs) such as tokenized stocks, ETFs to the blockchain. OGM Alliance, in partnership with Ondo Finance, will be the launch deliverer.
Due to decentralized platforms, users can access traditional finance markets in unprecedented numbers, with over 100 tokenized assets available on day one. Investors are expected to experience a profound liquidity and efficient access to services worldwide, and this is changing the way RWAs approach blockchain technology.
The Relative Strength Index (RSI) also closed at 66.74, which means that the market has experienced bullish pressure yet not to the point of being overbought. The RSI was also above its 56.49 moving average, suggesting the upward momentum was strong during the latest rally.
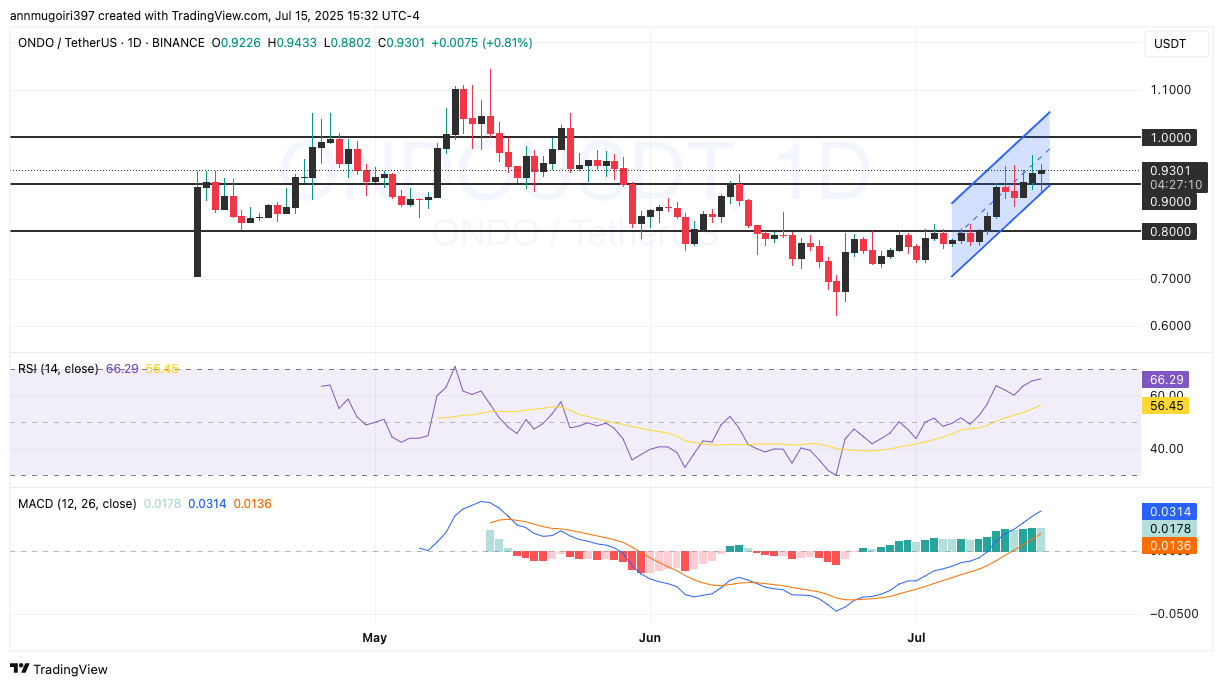
Meanwhile, there was still a bullish indication of the MACD signal as the MACD line (0.0317) was higher than the signal line (0.0137). The histogram bars also printed above correlate with the bullish crossover at the beginning of July.
Key Levels To Watch
The recent breakout above the $0.90 resistance area placed bulls in control, pushing price action toward the $1.00 psychological resistance. If ONDO closes above the $1.00 barrier, the next upside target may be $1.10.
In contrast, a pullback to the $0.90 level could be expected if selling pressure emerges. A further decline below $0.90 might trigger a test of the $0.80 support zone.
Disclaimer
This article is for informational purposes only and provides no financial, investment, or other advice. The author or any people mentioned in this article are not responsible for any financial loss that may occur from investing in or trading. Please do your research before making any financial decisions.




