
 Zerebro
 Bitcoin
 Aerodrome Finance
 ZKsync
 Pearl
Pearl Pudgy Penguins
 Bitway

Key Insights:
- XRP price confirmed a double bottom breakout on the 4D chart with a short-term target of $4.40.
- Analysts project that XRP could reach $7.70 to $33, based on patterns from 2021 and 2017.
- The average projected XRP target from past cycles is $20, excluding calculations for measured moves.
XRP price has broken a key resistance area, raising prospects that the asset has begun a wider cycle-wide rally. The short-term forecasts set a price of $4.40, whereas a macrocycle comparison set a much higher price target at $20 that may be realized with time.
XRP Price Broke Out of Double Bottom Formation
On the 4-day chart, XRP price broke out of a double bottom pattern, largely seen as playing out towards the end of an extended pullback. Analyst Steph Is Crypto noted that it started forming towards the end of March 2025, where two troughs were formed at the $1.85 level. This formed a neckline around $2.90, which XRP price passed through with strength to the upside.
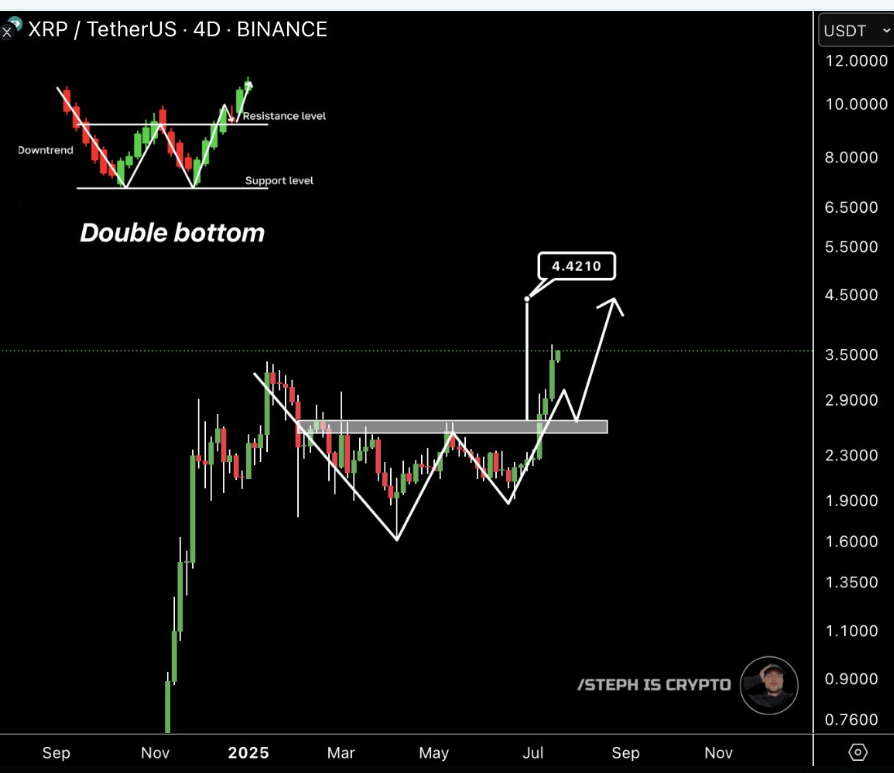
Additionally, the top altcoin has lately stabilized above the breakout price, with consolidation in an area that has turned into a support area. The estimated target of the pattern was between the neckline and the bottom of the double-bottom at approximately $4.40.
Moreover, Steph noted it as a technical breakout design because the price has closed above the neckline and with high trading volumes.
Analysts Refer to 2021 and 2017 Cycles for Macro Targets
Moreover, historical cycle comparisons also informed XRP price long-term projections. EGRAG CRYPTO pointed out the 2017 cycle as a point of reference when XRP exhibited a peak valuation that might translate to a target of about $33 if the same action happens. This model was based on price expansion and symmetry from past market tops to the current setup.
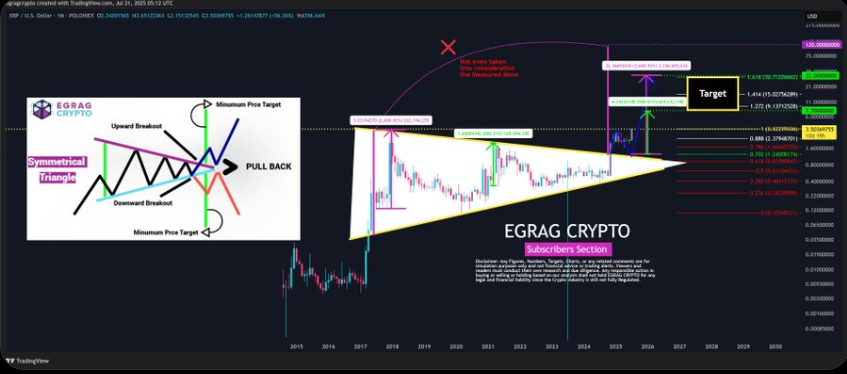
Conversely, the 2021 cycle offered a more conservative estimate of $7.70 based on similar movement in a symmetrical triangle. The formation of a triangle in the XRP macro chart covered multiple years, since 2018, and demonstrated indications of a possible breakout.
Confirming this trend can lead to big directional moves based upon volume and participation in the market.
Historical Averages Point to $20 Midpoint
Consequently, the two estimated targets, $33 and $7.70, put the average at approximately $20. The analyst proposed the figure as a potential peak in this cycle.
Nonetheless, this estimation excluded the measured move target of the symmetrical triangle, a different calculation frequently used to project the targets after a breakout.
Furthermore, EGRAG’s chart analysis also illustrated an upward path beyond Fibonacci extension levels. This indicated that the $20 average could act as a reference point rather than a cap. The analysis assumed a full breakout and retest within the triangle structure, then expanded toward the calculated targets.
By combining short-term breakout setups and historical cycle patterns, XRP price was in a case of potential trend continuation. The double bottom consisted of a change in accumulation to expansion, containing the XRP price structure in favor of the bulls.
In addition, the symmetrical triangle also offered context to the greater movements that might be realized in months.
Derivatives Show Bullish Bias and Short Squeeze Risk
Meanwhile, XRP derivatives data from Coinglass indicated robust market engagement. The trading volume increased by 45%, to $19.50 billion, whereas the open interest increased by 3.6% to $11.19B.
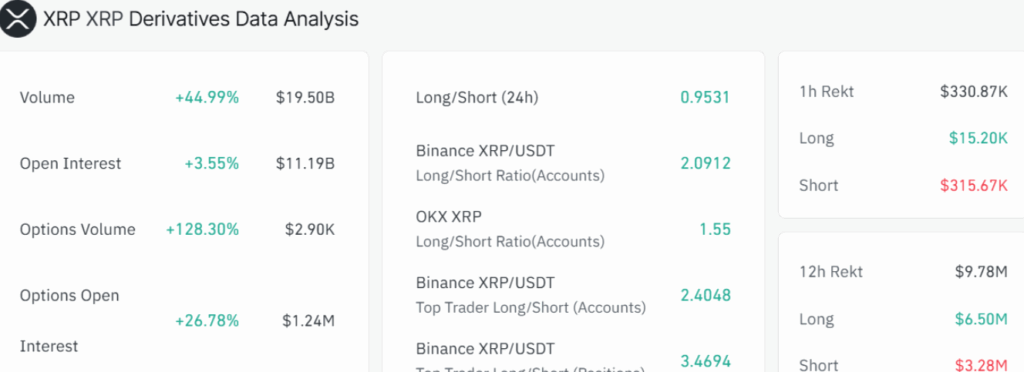
Additionally, the options volume increased 128.30%, and the open options interest rose by 26.78%. These increases signalled heightened speculative activity and stronger commitment from traders positioning for an upward price movement.
Besides, long/short ratios signalled bullish sentiment, particularly in Binance, where the leading trader’s long/short ratio stood at 3.4694. Nevertheless, short positions suffered massive losses as $19.09M was liquidated over the last 24 hours, and $15.81M during the last 12 hours. The data suggested bullish control amid massive short liquidations and growing leverage exposure.




