
 no crying in the casino
 NEAR Protocol
 Starknet
 Pyth Network
 Pearl
Pearl Quantus
 Pudgy Penguins

Key Insights:
- Floki price formed a double-bottom pattern near $0.00011, hinting at a 14x breakout.
- Analysts highlight $0.00036 as key resistance before FLOKI price can target $0.002 or higher.
- Retracement to $0.00012 is likely before Floki resumes its move toward Fibonacci peaks.
FLOKI price is showing early signs of a potential mega rally following strong structural shifts. Technical analysts indicated a confirmed bottom, breakout formations, and channel setup on the same that indicated a potential 14x upside. New chart implications now favored a bullish turnaround, with the immediate resistance at $0.00036 the next suitable obstacle.
FLOKI Price Forms Double-Bottom Pattern With 14x Potential
FLOKI price has broken out from a key bottoming zone, forming a bullish double-bottom pattern. According to CryptoELITES, the token has reclaimed the 61.8% Fibonacci level, bouncing near $0.0001100 and climbing to $0.0001450. The breakout has happened within an ascending parallel channel, with the projection lines aiming as high as $0.002.
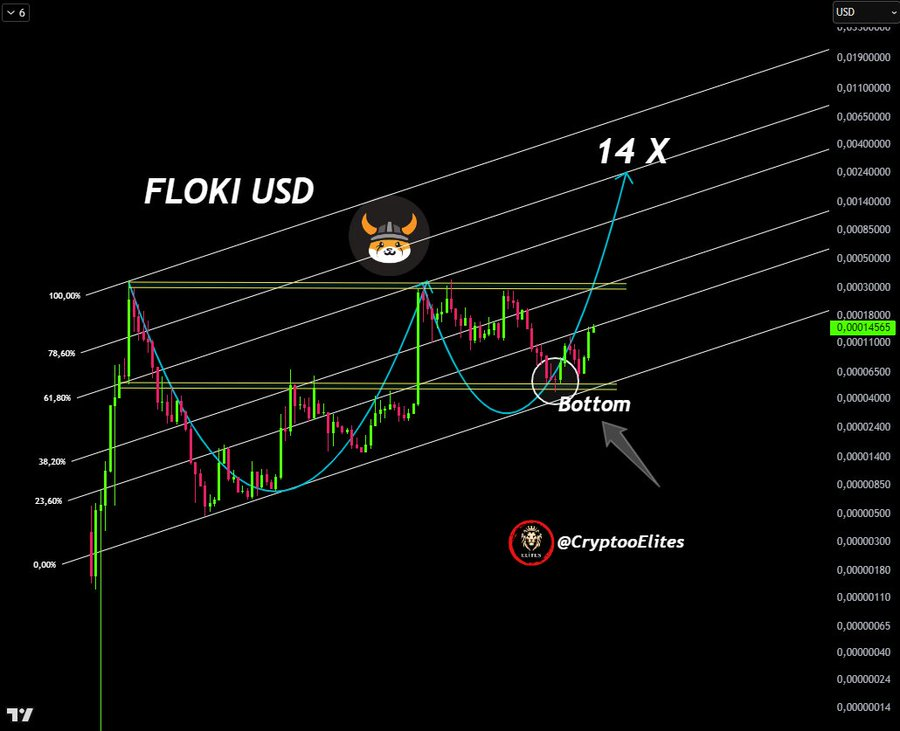
The chart showed a cup-and-handle formation supported by volume increases and convergence of trendlines. This reversal would be confirmed with a successful flip of the old neckline resistance at around $0.00036. The analyst marked a 14x upside target if FLOKI price sustains above that threshold.
This two-bottom line was compatible with the overall channel trend, which displayed growing power among buyers. The sharp move off the bottom could signal the start of a much larger move. However, confirmation will require sustained closes above horizontal resistance.
Resistance Zones Align With Historical Selling Pressure
Furthermore, a broader technical perspective by analyst Trendline supported the relevance of the $0.00036-$0.00042 resistance area. The long-term chart indicated that the price has responded to these bands within the last two years. The bottom support sits between $0.0000435 and $0.0000652, a region FLOKI price bounced from in July.
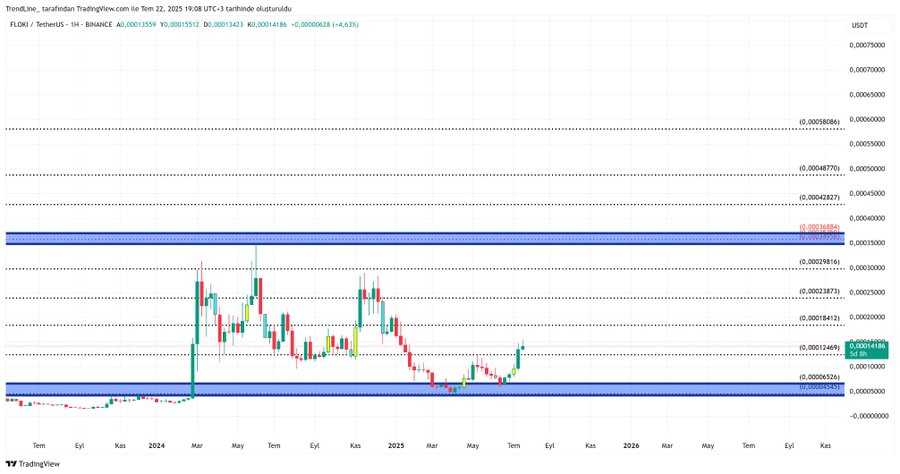
Since then, the token has bounced more than 30%, implying an increasing investor confidence. However, it has to face the thick supply zone, which had reversed it earlier in March and June. Volume profiles confirm heavy seller interest in this band.
The FLOKI price must be above $0.0004282 to trigger a full breakout with confirmation. Such would trigger the 14x target pathway and bring about the possibility of $0.002 to $0.004. Until then, the price is close to a certain range, accumulating pressure.
Multi-cycle Breakout and Reversal Structure
Adding further strength to the bullish case, analyst FriedrichBTC shared a long-term FLOKI price chart confirming a macro breakout. His chart indicated that the token was breaking out of a multi-month descending wedge and was retesting breakout levels successfully.
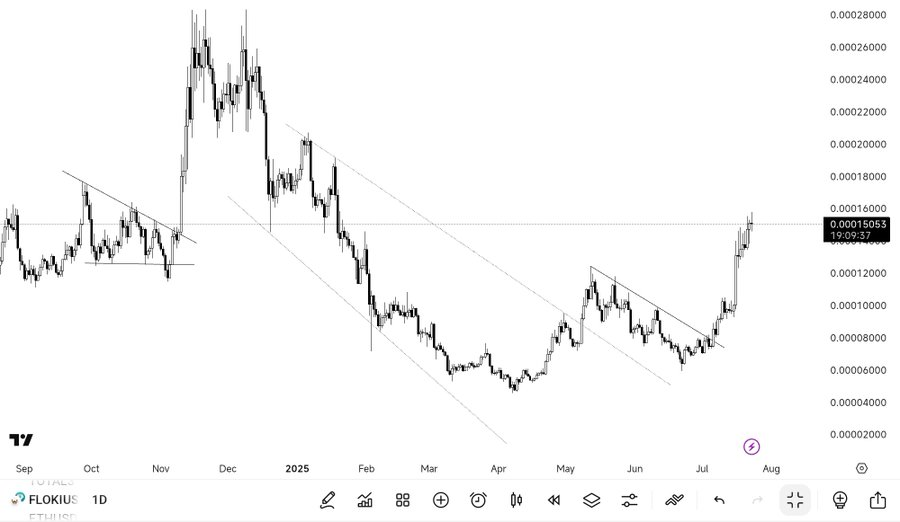
When writing, FLOKI price traded near $0.00015053, clearing diagonal resistance. The shift in market structure was a move to establish higher highs since late 2024. Friedrich characterizes it as a type of multi-cycle meme setup, and bears some similarity to previous exponential moves.
His message also stressed that there was a buy-in every dip with increased trader confidence. The technical breakout is reflective of a previous parabolic run. If history repeats itself, there might be a retest of the all-time high at $0.00028.
Short-term Retracement Expected
However, even with the rising optimism, analyst AGENT47 anticipated a small correction then followed by a further uptrend. He noted that FLOKI price has hit the upper Bollinger Band, indicating temporary exhaustion. His analysis indicated a decline in the direction of the $0.00012 accumulation area.
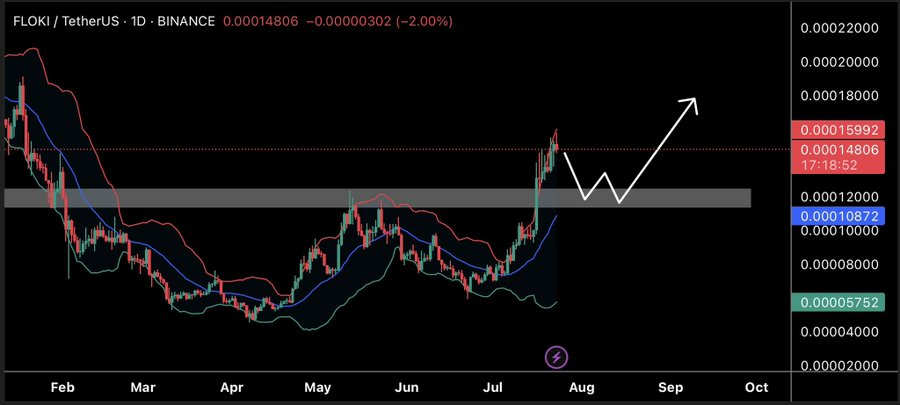
This was in line with a classical breakout-retest pattern, where price retraces its support, then continues with an up move. The next step may rise outside the gray support zone near $0.0001200 to $0.0001250. The rebound in this area would signal a confirmation of a higher low and reinforce the bullish pattern.
The retest also offered an opportunity for new accumulation. A successful dip-and-hold would occur as the volume increased during the breakout, indicating institutional confidence.
Disclaimer
This article is for informational purposes only and provides no financial, investment, or other advice. The author or any people mentioned in this article are not responsible for any financial loss that may occur from investing in or trading. Please do your research before making any financial decisions.



