
 Doge Pepe
 Wisp
Wisp Pons
Pons Zylo Ecosystem
 Bunker Mode
 Quantus
 Pearl
Pearl

Key Insights:
- Stellar forms bullish flag, signaling potential breakout from wedge.
- TVL surges 186%, showing strong on-chain network fundamentals.
- A break above $0.44 may trigger move toward $0.50+.
XLM crypto has come under a slight retracement that saw it fall 2% to trade at approximately $0.405 as of press time. Nonetheless, technical chart patterns point to the digital asset being preconditioning itself to a breakout in the short term despite this temporary handicapping.
XLM Crypto Bullish Continuation Pattern Dominates Technical Setup
Ali Charts shows a clear bullish flag pattern that came after a powerful uptrend at the beginning of the month of July.
The event before the flag was a rally where the Stellar price advanced in a few days to see the currency rise beyond $0.47. Since that time the asset has retraced to the $0.786 Fibonacci level at the price of roughly $0.4126. The asset has previously visited this area as support during bullish reversals.
In addition, Fibonacci extension levels indicate potential price targets of $0.50 (1.0), $0.62 (1.272), $0.70 (1.414) and $0.81 (1.618), offering a multi tiered roadmap should the bullish momentum come back.
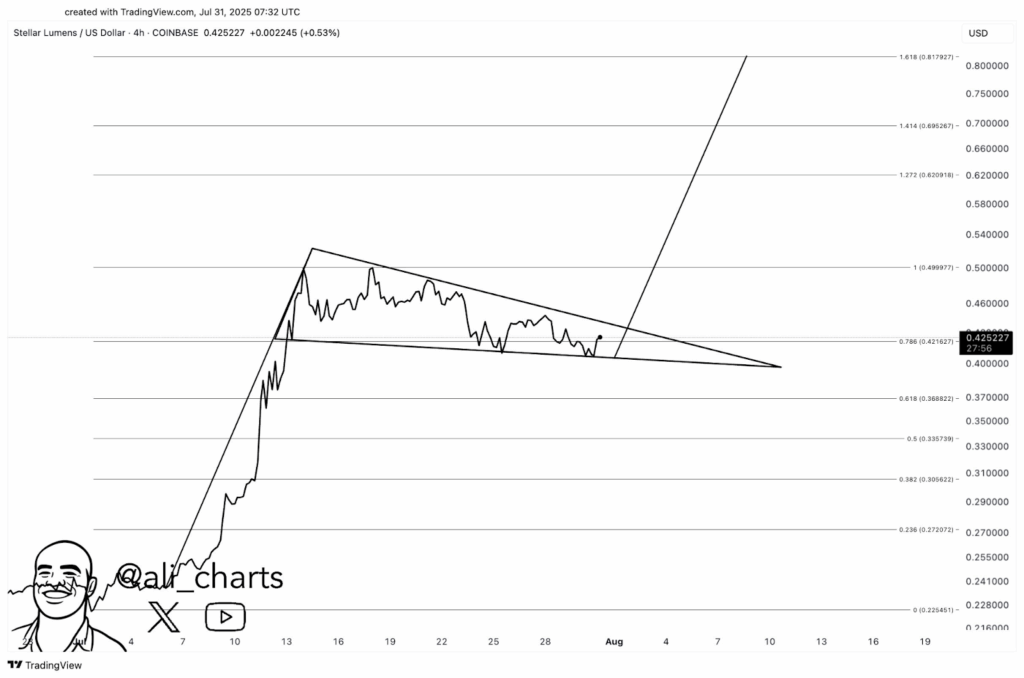
These levels also overlap psychological resistance areas, which may come into play in case of a breakout that is confirmed at strong volumes.
The falling wedge pattern is also confirmed on the secondary chart by the TradingView site. The pattern is represented by the same declining trendlines to encompass the price movement.
The weaker highs and the trend of steady support at around $0.40 further put a strong case in expecting a breakout soon, in case the buyers again take charge.
There are still mixed dynamics, however, in terms of volume. The volume delta chart on Binance 4-hour candle structure has maintained a negative figure, meaning that there is a higher amount of selling pressure than buying in the previous sessions.
The falling wedge has held onto its pattern, but since the volume has not spiked out much, a breakout may take longer. Due to this, the sideways movement makes it necessary to have some kind of catalyst that will pick up the bull run again.
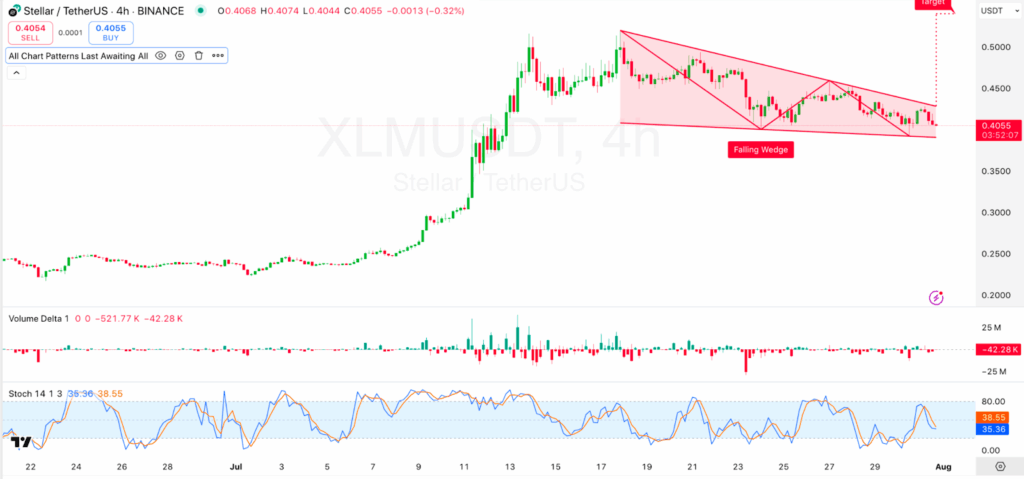
On the same chart, stochastic RSI (14, 3, 3) is at 38.55 and 35.36 on the %K and %D lines, respectively. The indicator is already at a neutral position. As it has swung back off the oversold positions earlier in the week.
Crossover above the levels would give out a bullish indication, which has still not been strongly supported, however.
XLM Crypto Network Fundamentals Strengthen as TVL Surges
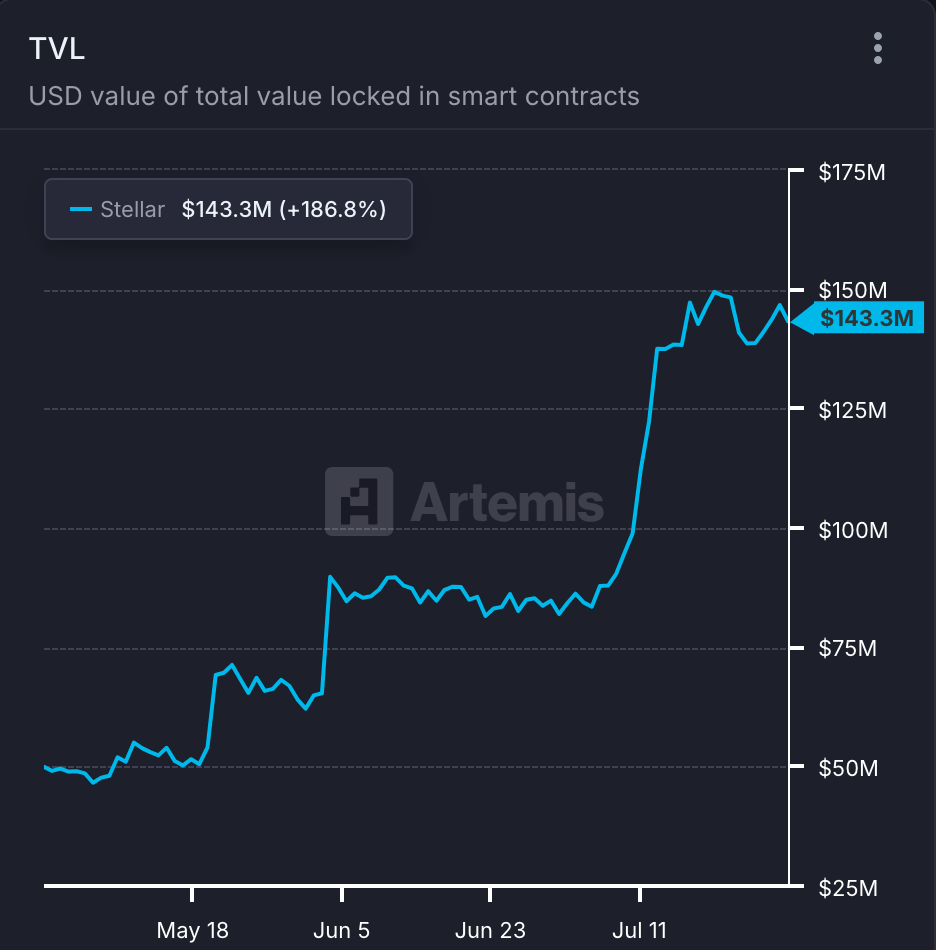
On top of price charts, key metrics on Stellar demonstrate a strong growth. Data by Artemis indicates that Stellar total value locked (TVL) on smart contracts has grown by 186.8%. To reach the amount of 143.3 million in less than three months.
The TVL went below the $50 million mark in the middle of May. And reached above the $150 million mark in the middle of July. This is related to the increased demand to benefit from the on-chain utility and decentralized apps of the Stellar network.
This increase in TVL indicates the increased activity of developers. As well as the involvement of users in DeFi protocols on Stellar. It is one of the most important measures and can sustain higher assets values when it is observed.
It is identified as the upper edge of the descending wedge. Which is close to $0.44 and serves as the most crucial immediate resistance. The break above this level and the increase in the trading volume. Can confirm the bullish flag scenario and push XLM to $0.50.
On the other hand, a breakdown of the lower wedge support at the $0.40 mark. Can subject the Stellar price to test the lower Fibonacci retracement levels at the $0.3688 and $0.3357.
The short-range dynamics will probably be determined by the more general mood in the market. And the events related to Stellar. The close monitoring of traders and investors will be the occurrence of a breakout confirmation. Preferably with the attendant growth of TVL, better volume patterns. And a bullish crossover on several indicators such as the Stochastic RSI.
Disclaimer
This article is for informational purposes only and provides no financial, investment, or other advice. The author or any people mentioned in this article are not responsible for any financial loss. That may occur from investing in or trading. Please do your research before making any financial decisions.




