
 Zerebro
 Bitcoin
 Quantus
 Pearl
Pearl Starknet
 ZKsync
 NEAR Protocol

Key Insights:
- Cardano price holds inside a critical Fibonacci range, mirroring 2020’s pre-rally pattern.
- Coinglass data shows ongoing liquidations with both long and short positions flushed.
- Analysts suggest current consolidation stems from accumulation, not panic selling.
Cardano (ADA) is in a technical price structure closely related to the recovery periods experienced in 2020.
Although ADA has been under downward pressure during the last seven days, it is making fresh attempts to revise its critical Fibonacci lines as well as continuing to move upwards. The Cardano price stood at $0.7226 as of press time.
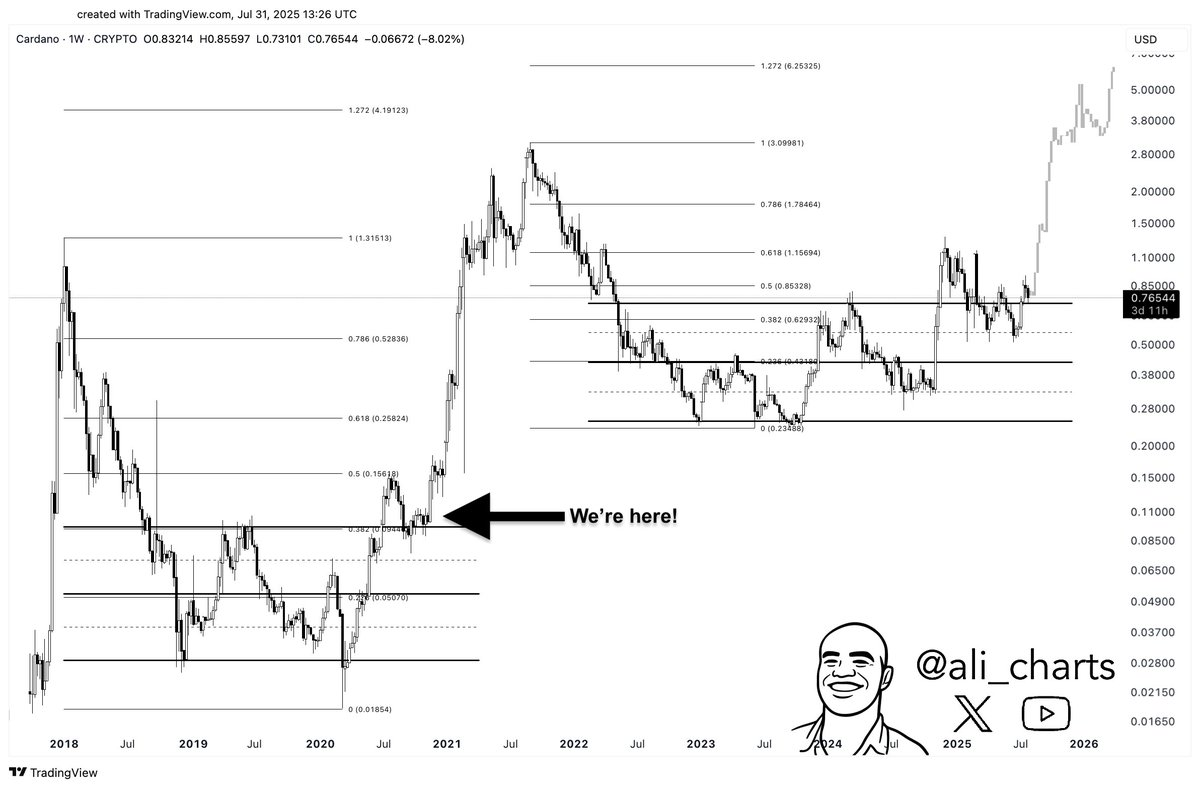
The weekly chart also shows that ADA has been structurally positioned in the same manner as its past breakout period back in late 2020. The increase was accompanied by a prolonged rise and a double bottom. This led to a successful test of 0.382 Fibonacci retracement level at the point. The development today is showing the same trend as a less volatile slope, however, may be more of an organic accumulation period.
Current Fibonacci Levels Signal Ongoing Reaccumulation for Cardano
The trading range of ADA reached the 0.382 ($0.62392) to 0.5 (0.85328) Fibonacci-level zones between. This is based on a springboard of past bullish activity.
The previous cycle demonstrated that ADA tested constructively above the $0.5 mark and then rose to more than $3.00 within weeks. ADA Later hit around $3.10 and then retreated.
The combination of the current consolidation stage below the 0.5 Fibonacci level along with the flattened momentum implies less by speculation and more by spot accumulation.
The previous cycle shows that such a level as the 0.618 Fibonacci retracement (1.15694), represented a resistance ceiling. This is before the price lifted off to all-time highs.
Cardano Liquidations Signal Market Uncertainty
Data from Coinglass shows ADA experienced notable long and short liquidations over the past week. The largest liquidation spikes occurred around July 21 and again near the month’s end.
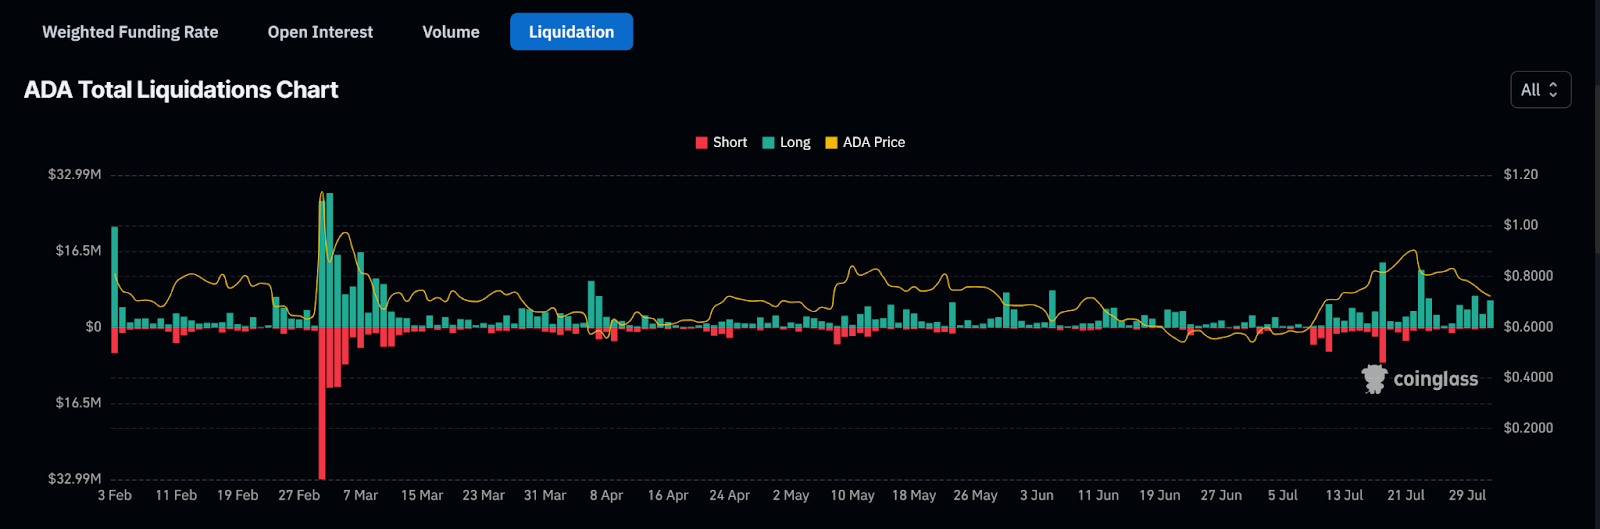
These liquidations closely aligned with failed breakouts and resistance rejections, particularly at the $0.85 level. On-chain metrics reveal long liquidations surged during the price dip, indicating that bullish positions were caught off guard as the rally lost momentum.
Earlier liquidation activity in June also reflects increased market tension. Short positions were flushed out first, followed by longs in July—creating a whipsaw effect typical of indecisive markets.
At the time of writing, the Cardano price fluctuated between a low of $0.7100 and a high of $0.7703. The narrowing range suggests growing pressure for a breakout or breakdown, as traders wait for a confirmed directional signal.
Tight Trading Band Suggests Market is Accumulating, Not Capitulating
The past two years have seen ADA volatility decline compared to prior cycles. This behavior often reflects a shift toward longer-term holder behavior and away from short-term speculation.
Analysts point to this reduced reactivity as a sign of market maturity. Historically, such periods of low volatility and structural accumulation have preceded steep upward moves.
Despite price slipping from $0.85 highs, bulls continue defending the $0.70–$0.75 zone. For ADA to revisit the $1 mark, buyers must reclaim the 0.5 Fibonacci level. Until then, the current structure favors slow accumulation, with the $0.62–$0.85 band acting as the accumulation range.
Whether ADA can replicate its 2020-style breakout remains to be seen. But for now, the charts suggest the market isn’t selling in panic—it’s preparing.
Disclaimer
This article is for informational purposes only and provides no financial, investment, or other advice. The author or any people mentioned in this article are not responsible for any financial loss that may occur from investing in or trading. Please do your research before making any financial decisions.




