
 Bitcoin
 Ondo
Ondo Pudgy Penguins
 Walrus
 Pons
Pons Quantus
 NEAR Protocol

Bitcoin price action has reached a pivotal stage, with analysts offering sharply different outlooks. Recent information indicated the market was in a balance of both bullish continuation and a correction pullback. Whale activity, technical configurations, and market cycle alignments are defining the argument on whether the next step is towards $200,000 or a downward plunge towards $77,000
Elliott Wave Points to Rally Continuation for Bitcoin Price
Trader Tardigrade’s technical chart applied the “Power of Three” model to Bitcoin price action. This model divided the market trends into accumulation, manipulation, and distribution phases. Bitcoin appeared positioned in the distribution phase, historically preceding significant upside acceleration.
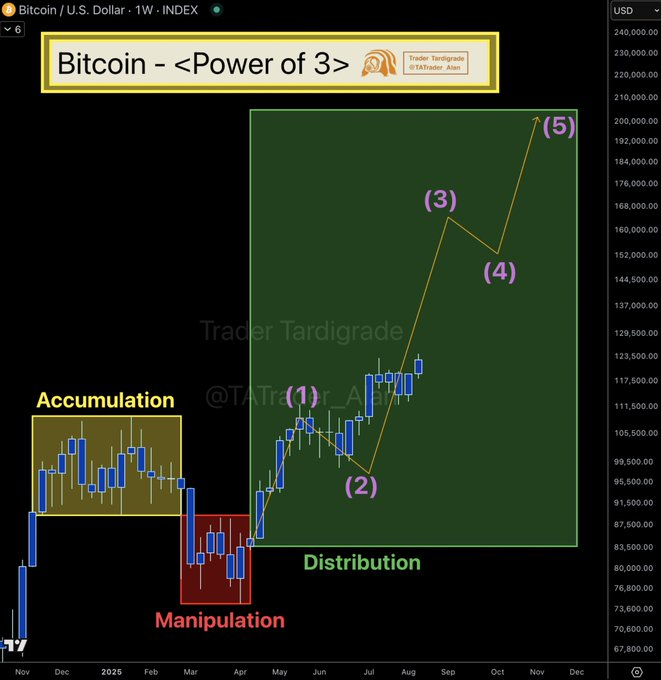
According to the Elliott Wave count, wave one and wave two were already complete, and wave three was highly extended. Then it was followed by a corrective wave four, and this prepared for the move higher in wave five.
This formation predicted a possible move to $200,000 before the subsequent consolidation period. Furthermore, comparable wave formations have appeared in earlier Bitcoin market cycles.
Whale Activity Concentrates Near $118K Support
Interestingly, Lookonchain data revealed that prominent trader Machi Big Brother has increased his long positions in both Bitcoin and Ethereum. Current holdings include 50 BTC worth $5.9 million at 40x leverage and 21,900 ETH worth $100 million at 25x leverage.
Entry points for BTC are clustered between $118,022 and $118,040, indicating accumulation around the $117.5K–$118K range.
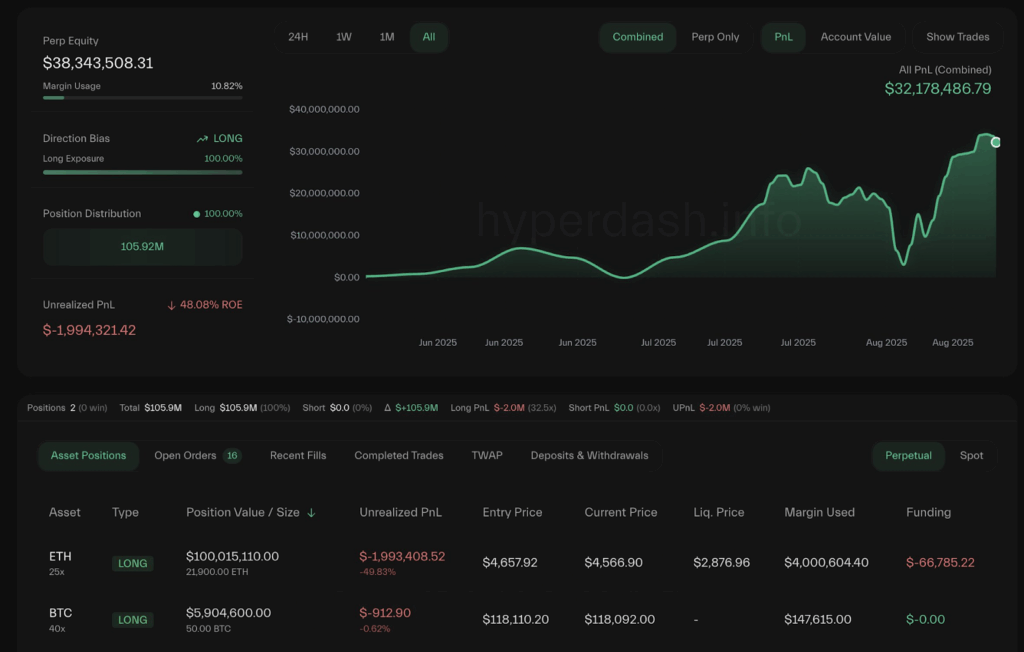
Bitcoin positions were concentrated between $118,022 and $118,040, suggesting targeted accumulation at this range. The value of these trades was $105.9 million, with only $32 million actual profit compared to $2 million unrealized loss. Leverage increased possible gains and losses, solidifying the importance of the support at 118K as a key level.
CME Gap Fill Aligns With Bitcoin Price Technical Rebound
More so, TedPillows pointed to a technical event where Bitcoin filled its CME futures gap before bouncing from $117.5K. This area has functioned as a good support and has been historically linked to temporary pullbacks following gap fillings.
The bounce came at the prices at which the Machi Big Brother concentrated on holding high leverage, resulting in a possible consensus among large traders.
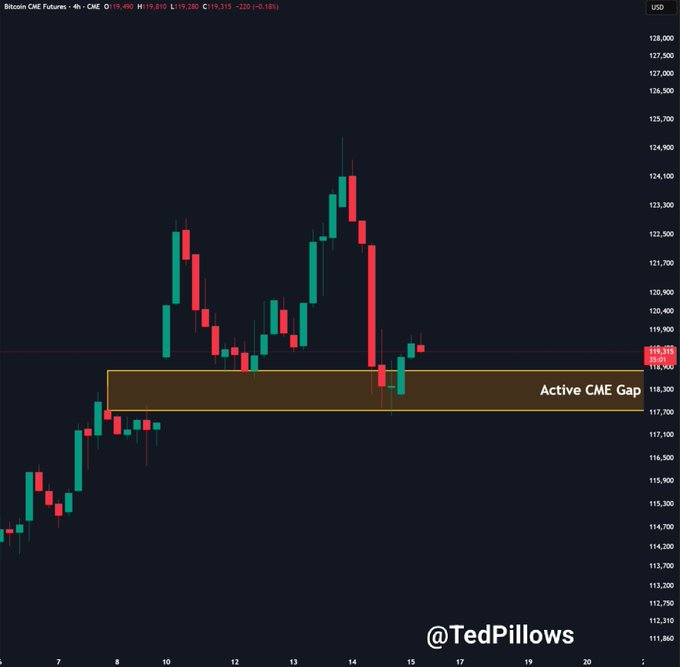
Technical analysis confirmed Bitcoin had filled its CME futures gap before reversing from the $117,500 support zone. This level was an important inflection point of previous trading sessions. There was a rebound with visible accumulation by large holders, and this further supported bullish dispositions.
CME gap fills often precede directional market moves. This reaction implied that a fresh move up could still occur should there be an increase in buying volume. Keeping BTC price above $117,500 might help in supporting short-term bullish movement.
However, the decisive break below this level would undermine the short-term bullish formation and open the way to more significant corrections.
Alternate Projection Indicates Multi-Wave Correction
However, contrary to the bullish expectations, CasiTrades expected a more extended corrective ABC pattern to play out. Wave A’s short-term target is $77,000, and a 5-wave correction begins at $112K,000.
This roadmap projected a short-term rally at $120K-122K, a correction at $89K, another retest at $100K, and the final decline at the $77K level.
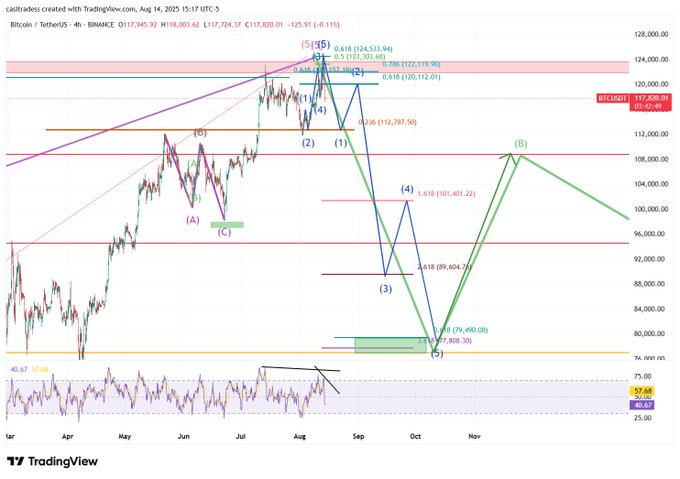
According to this view, such a correction could trigger capital rotation from Bitcoin into altcoins. CasiTrades noted that once Bitcoin price completes Wave A near $77K, large caps and smaller altcoins could experience explosive gains. This setup puts $112K as a critical pivot, whether the market decides on continuation or a deeper slump.


