
 Pearl
Pearl ZKsync
 Bitcoin
 Starknet
 Quantus
 Puffer
 Lighter
The asset management giant BlackRock is linked to the recent fall in the crypto market. Recently, the blockchain-based transaction tracker Lookonchain shared a post on X. they noted that BlackRock is selling Ethereum (ETH) and Bitcoin (BTC).
BlackRock Dumps Bitcoin and Ethereum
In the past 24 hours, the asset manager made a major crypto move. They deposited 1,885 BTC valued at $111.66 million to Coinbase Prime. Additionally, 59,606 ETH worth $254.43 million was transferred to the same platform.

Speculation around the impact of BlackRock on the crypto dip is gaining traction. Sentiment shifted noticeably after their large ETH and BTC deposits. This was followed by a series of red candles on the price charts, fueling concerns.
Current Price Momentum and Traders’ Liquidation
At press, both BTC and ETH slipped 1.50% and 1.80% over the past 24 hours. It stood at $113,050 and $4,285. The decline in Bitcoin and Ethereum prices has shaken market confidence.
Investor and trader participation dropped noticeably. As a result, trading volumes fell by 12% and 30% during the same period. This notable drop in asset prices has triggered massive liquidations.
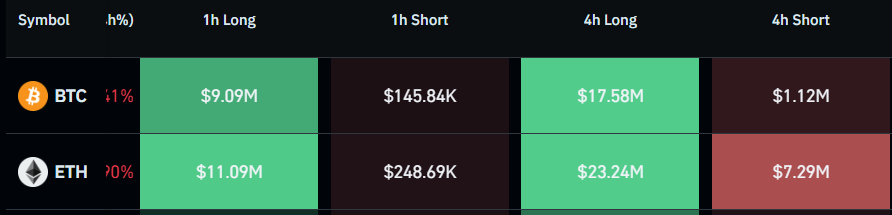
Over the past four hours, traders liquidated $17.58 million worth of BTC and $23.24 million worth of long positions.
At the same time, $1.12 million worth of BTC and $7.29 million worth of short positions were liquidated. This shows that traders’ bullish sentiment vanished with the fall in BTC and ETH.
Bitcoin at Crossroads: Bullish Setup vs. BlackRock-Driven Bearish Fears
Expert analysts suggest Bitcoin is forming a bullish double-bottom pattern. This setup often signals a potential price reversal. The current level could mark a turning point for upward momentum. The recent activity of BlackRock adds further intrigue to the timing of this shift.
On the daily chart, BTC is at the lower boundary of the Bollinger Bands, which suggests a potential reversal. Historically, an upside rally has been recorded whenever the asset price has reached the lower boundary. Also, this time, similar speculation is emerging.
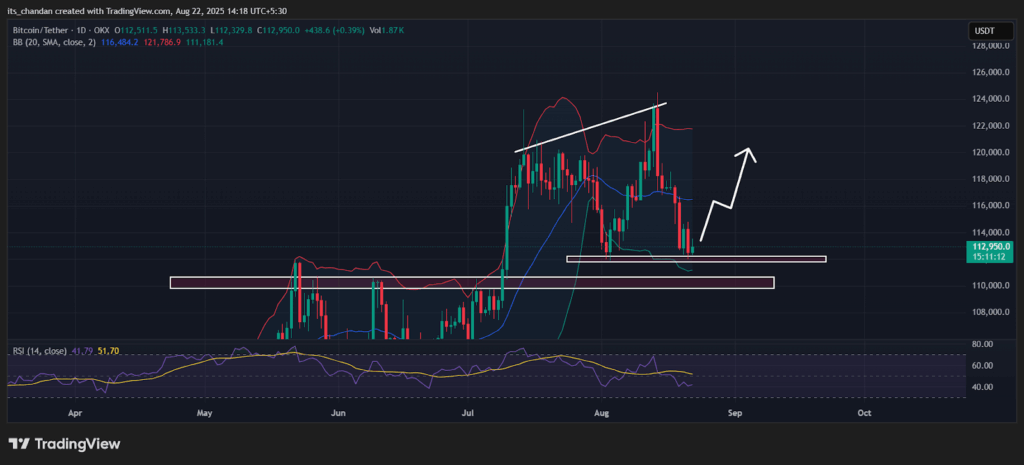
If Bitcoin holds the current level or sustains above $112,000, there is a strong possibility of upside momentum. If this happens, the market could see a sharp recovery, with the price rising by 6%.
Currently, the Relative Strength Index (RSI) stands at 42, near the oversold territory. This suggested a potential price recovery if momentum turns bullish.
Given the current market sentiment and downside momentum in the top asset. Recently, a prominent crypto expert shared a post on. He noted that Bitcoin (BTC) is testing a key support level of $112,000 there.
The post on X warned that if Bitcoin doesn’t hold its current level, it may drop to the next support at $108,000.
This potential decline is being closely watched, especially in light of the recent market moves by BlackRock. This downside speculation hints that experts have a bearish outlook for Bitcoin.
Ethereum (ETH) Price Action and Upcoming Levels
Ethereum (ETH), on the other hand, appears bullish and is poised for a significant price uptick. The asset has successfully broken out of the descending trendline on the four-hour chart. This had been acting as resistance since August 14, 2025.
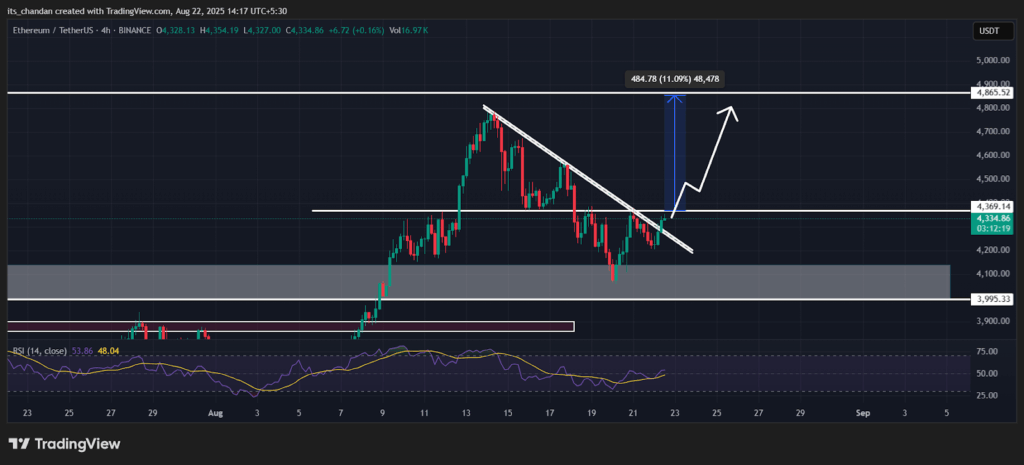
ETH is currently showing strong price action. If it holds above the $4,200 level, bullish momentum could build. Analysts predict a potential 12% surge. This would push ETH toward the $4,865 mark in the near term.
The chart looks clear at press time, with the only hurdle for ETH currently at $4,370. If this level is cleared, ETH may see a parabolic move.
ETH’s Relative Strength Index (RSI) stands at 55 as of writing. It is above the neutral zone but below the overbought territory. This suggests that the asset has enough room to continue its upside momentum.




