
 Zerebro
 Bitcoin
 Aerodrome Finance
 ZKsync
 Pearl
Pearl Pudgy Penguins
 Bitway

XLM crypto is setting up for a possible breakout toward $0.41 after weeks of sideways trading. Analysts cited solid support and key resistance levels that could enable bulls to maintain pressure and push the price higher.
XLM Crypto Price Targets $0.41
Ali Charts reported that the XLM price could surge to $0.41 if buying momentum strengthens. His 4-hour chart showed Stellar forming higher lows while holding a critical support zone near $0.35.
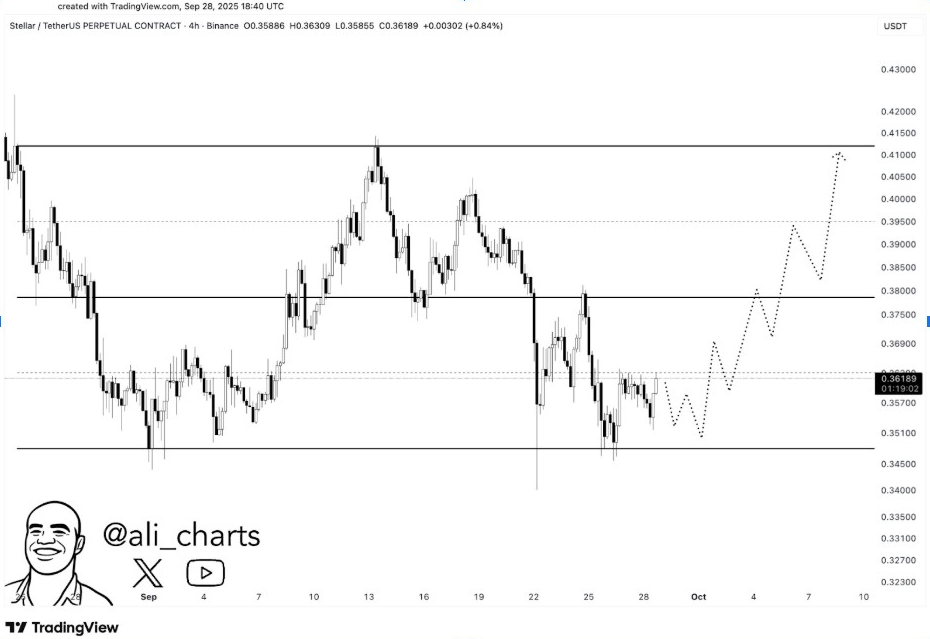
Ali explained that the first challenge lies at $0.378, which was the immediate sell wall. A clean break above this point may trigger new bids and confirm a short-term bullish reversal.
Maintaining the $0.35 floor is crucial for preserving this pattern and sustaining bullish sentiment. The analyst’s map indicated a step-wise advance from $0.35 down to $0.378. This development sets the stage for XLM crypto to reach $0.41.
The price target reflects growing momentum and bullish sentiment. If buyers can hold volume through these levels, then the breakout could extend beyond the initial target.
Bull Market Support Band Holds Critical Level
Steph Is Crypto observed that the XLM price is currently testing its bull market support band. This level sits around $0.35 on the weekly chart, signaling a key technical zone. This band served as a springboard in 2017 and 2021, sparking powerful rallies each time.
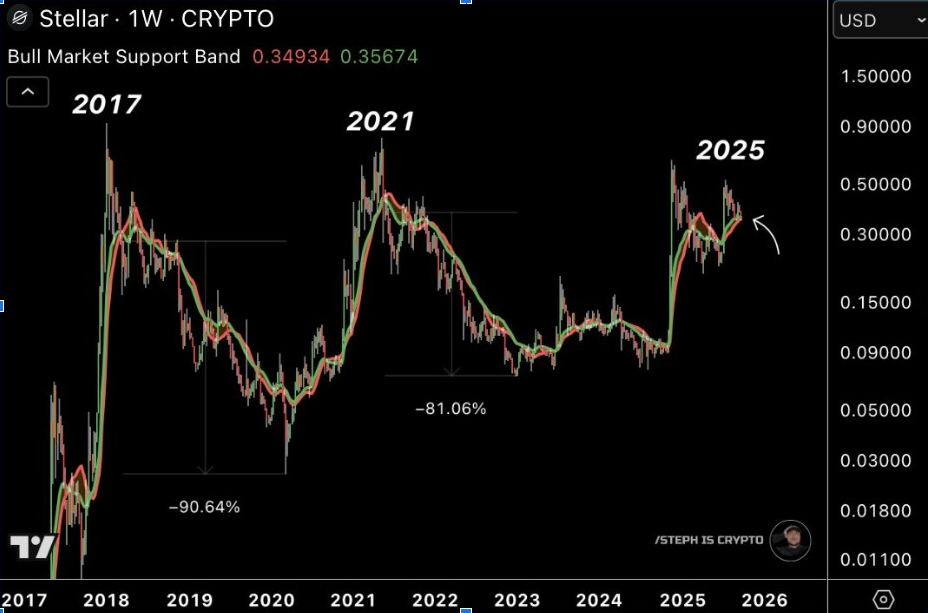
Holding this historical zone indicates that the larger uptrend is still intact. According to Steph, XLM crypto staying above the support band helps prevent deeper price drops. It also strengthens the case for a prolonged bullish cycle.
However, losing this level may set back the upside move. Steph warned that a weekly close below the band could invite renewed selling pressure and delay a fresh rally.
Macro Breakout Pattern Signals Upside Potential for XLM Crypto
Furthermore, Cryptollica also provided a macro view. This suggests that the XLM price is now trending downward, following a line that dates back to 2018.
His chart had a history of frequent rejections at this resistance. However, it presented a narrowing arrangement in the shape of a large cup and handle pattern.
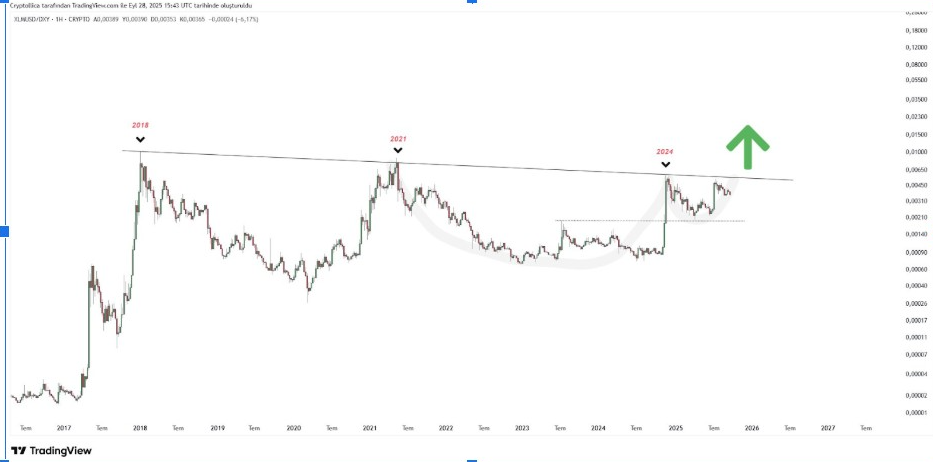
A decisive weekly close above the descending trendline could mark the end of years of compression. Cryptollica believed such a breakout might be the gateway to a robust multi-month rally. This may reach new cycle highs above $0.50 and surpass them.
This long-term setup supports the bullish outlook for XLM crypto. It aligns with shorter-term signals from other analysts. If current support levels hold, XLM could be primed for an upside breakout.
Sell Walls and Demand Zones
However, CW analyzed order book data and confirmed the first major sell wall for XLM price lies at $0.378. Breaking this resistance is crucial for bulls to reach higher resistance levels near $0.41.
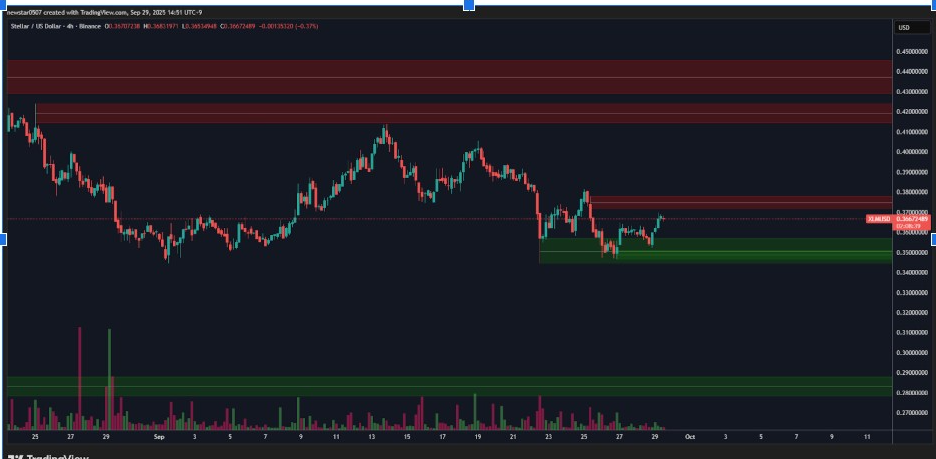
Below the current price, CW saw a demand zone between $0.34 and $0.35. This zone has repeatedly absorbed the selling pressure and offered the base for the former rebounds. Continued accumulation here will likely be the foundation for any sustained advance.
If buying activity picks up, XLM price could challenge the overhead sell wall. CW believes this move may trigger a stronger rally. The price could then accelerate toward $0.41 and beyond. Failure to defend $0.34, however, could weaken the bullish case and start a short-term pullback.



