Wisp
Wisp Doge Pepe
 Crawlerpad
 Zylo Ecosystem
 Pearl
Pearl Basic Attention
 Quantus

The Ethena price is still trading in a tight range and is experiencing significant resistance at the $0.67 mark, as the market stabilizes after several weeks of a downward trend. The token declined by around 2% in the recent sessions and has since stagnated at $0.52, as indicated in the latest daily trading statistics.
Although the movement is low, Glassnode and TradingView data show a massive supply around key cost basis areas, which currently mark the most useful areas of support and resistance in Ethena.
Ethena Price Resistance Builds Near $0.67 as Sellers Dominate
Recent on-chain cost basis data showed a dense concentration between $0.66 and $0.67 — Ethena’s current resistance zone. About 958 million ENA tokens were purchased here, creating pressure as holders reached breakeven and began selling.
Such clusters often trigger short-term profit-taking and slow upward movement. The $0.67 barrier has become a technical ceiling, requiring stronger volume to break.
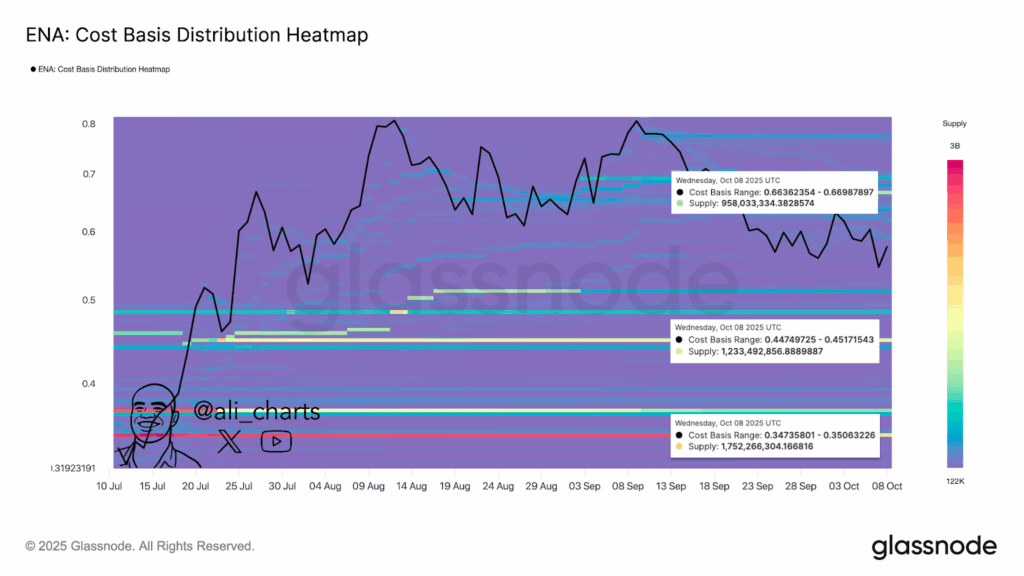
In the past, these concentrations of observed prices have identified regions of profit-taking or less intense purchasing pressure, preventing short-term upward movement. The ceiling of $0.67 is therefore a psychologically and technically critical point for market participants, and it would need a substantial increase in volume and impetus to be broken.
According to the current market price, the Glassnode heatmap displays two significant support zones, indicating the last time high quantities of ENA were shifted. The former, 0.44 to 0.45, contains approximately 1.23 billion ENA, and this range of demand falls between the lower and upper limits of the existing consolidation range, as shown on the TradingView chart.
A stronger structural support zone can be observed further down, at a range of 0.35 to 0.34, where 1.75 billion ENA tokens were accumulated. It is one of the most important bases of the entire heatmap and was in its place since the end of July.
These levels indicate high historical accumulation, whereby investors have already entered the market at low prices. If the price of Ethena keeps falling, these bands are the ones that traders are keenly watching as possible areas where the price can stabilize or have short term rebounds.
Ethena Price in a Downtrend Channel
According to the 1-day Ethena price charts, it is currently traded in a falling channel, which has determined its course of action since mid-September. The two have tried to break the 0.52 to 0.55 support level but have been unable to break the 0.67 level of resistance.
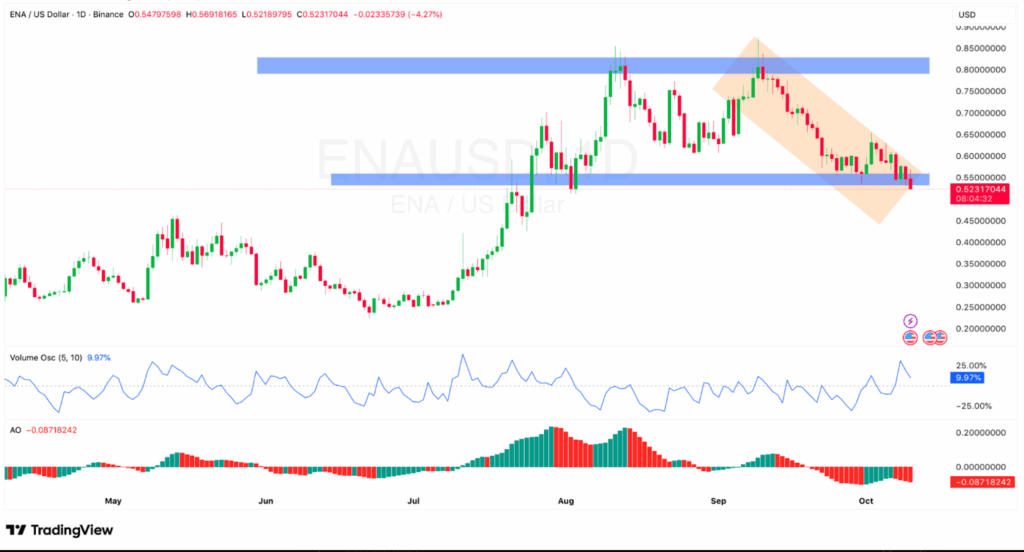
The Awesome Oscillator (AO) is currently showing negative values near -0.087, which supports the existence of bearish momentum. Meanwhile, the Volume Oscillator hovered around the 10 percent mark, which means that the volume changes are slight, but the power to change the trend is still weak.
The macro price formation indicates individual decreasing highs and decreasing lows, as is characteristic of a consolidation period in a downhill direction. The declining price trend, as indicated by the trend line on the chart, suggests a potential further increase in selling pressure as trade warriors take advantage of the resistance rejection.