
 Pearl
Pearl Bitway
 NEAR Protocol
 Sui
Sui Pudgy Penguins
 Starknet
 Pons
Pons

The Gold price has gone parabolic, surpassing critical Fibonacci extension levels of between 1.382 and 1.414. These have been pivotal areas where market acceleration has been recorded in the past.
Historical Setup Shows Strong Parallel Between Gold and Bitcoin
Following recent market statistics, Gold has surged above $ 4,000 an ounce, marking its best increase in decades. The existing chart design resembles a major technical breakout strategy. That’s similar to the one observed in the 2024-2025 price action for Bitcoin.
Gold’s rise beyond the $2400 zone at the 1.382–1.414 Fibonacci level triggered rapid growth. This upward move pushed the price quickly to $4045. The breakout validated a clean move above long-term resistance that had been made since 2011.
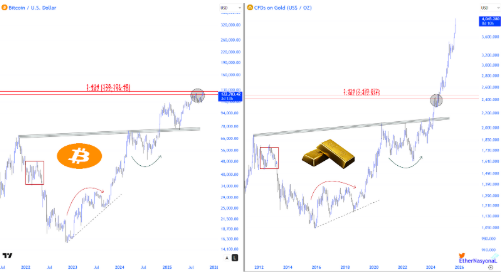
Bitcoin price is consolidating at its respective Fibonacci extension level, between $122,000 and $128,000. The arrangement suggests that Bitcoin is in the gold pre-parabolic stage before its potential explosion.
Bitcoin is currently in the final consolidation stage within the same range, suggesting that it is poised for a surge. The result has yet to be validated based on market data. However, the technical similarity reveals a significant cyclical correlation between conventional and online store-of-value assets.
The ascent of Gold is a parabolic one that is part of an overall shift in global capital mobility. Precious metals have surged during years of dollar debasement. Since early 2025, the price of Gold has increased by more than 50%.
The relocation shows rising investor interest in inflation hedges and value preservation. This comes at a time when fiat currencies are performing poorly. Silver has not been left behind, and it has also soared to its highest point in 45 years, at more than $50 per ounce.
Bitcoin’s Current Position Reflects Early-Stage Gold Dynamics
Bitcoin price, at $122K, is just short of its 1.382-1.414 Fibonacci level. In the past, this level has been a critical breakout point towards transitioning assets between accumulation and expansion.
The chart shows higher highs with narrowing consolidation near the resistance level. This pattern repeats the pre‑breakout behavior of Gold in late 2023. The market situation accentuates the similarity between the structures.
Global liquidity has increased. Inflation expectations are rising. Falling trust in fiat currencies has driven inflows into hard assets. Following the breakout of Gold, the U.S. dollar index (DXY) fell significantly, which accelerated the pace.
The trends are similar in macro conditions. The USD is heading towards its worst performance since 1973, falling by more than 10% through the year. Additionally, the price of Bitcoin has been steadily stagnating at record-high levels.
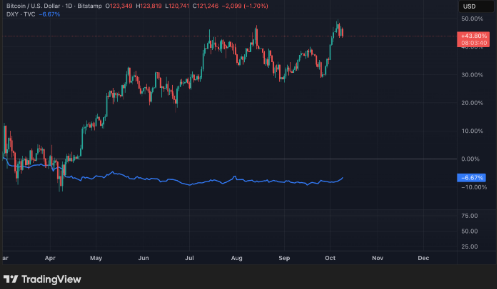
According to market strategists’ forecasts, capital flow to Bitcoin may increase as gold gains maturity. This argument is based on relative value.
The price-to-performance ratio of Gold has increased significantly. However, Bitcoin is still underestimated on a historical risk-adjusted scale.
Matt Hougan is the Chief Investment Officer at Bitwise. He noted that steady dollar debasement is taking place. This is pushing investors to diversify into both safe‑haven and risk assets.
He mentioned that the USD has lost 40% of its buying power since 2000. Gold is performing well in this environment. Bitcoin is also showing strong performance. Investors are using both assets to hedge against structural inflation and low real yields.




