
 Bitcoin
 Pearl
Pearl Starknet
 Zerebro
 NEAR Protocol
 Solana
 Quantus

Solana price is at a decisive point as traders monitor the $217 support. Analysts expect volatility ahead of the ETF decision, which could affect market direction. Technical indicators indicate both bullish and bearish scenarios occurring on several timeframes.
Solana Price Holds Key Support Before ETF Decision
Analyst Ali said Solana’s short-term structure is testing the $217 support, which could determine its next move. On the 30-minute chart, Solana is trading around $220.64, having reached a low at $219.76. The level at $217 is a crucial make-or-break point, separating potential recovery from further decline.
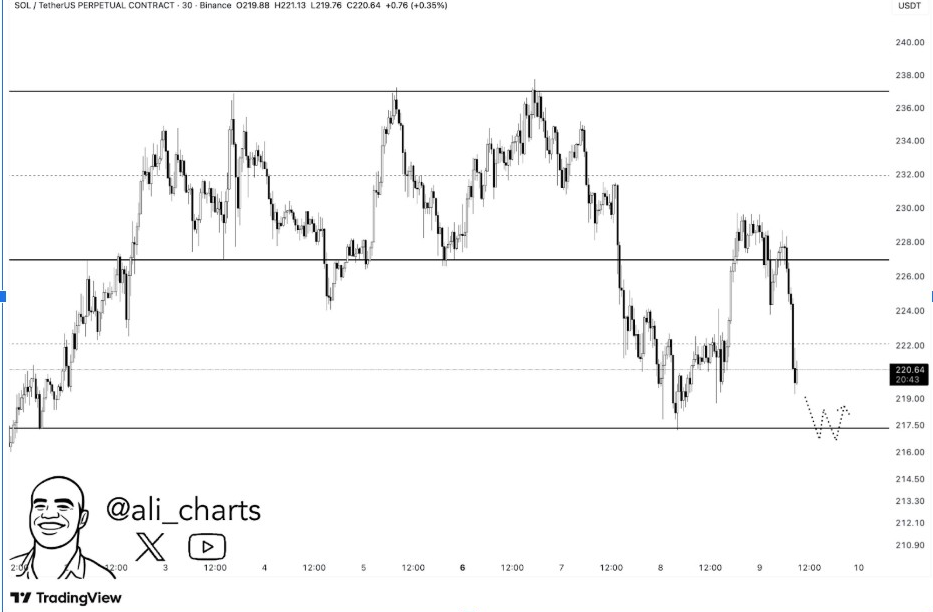
According to Ali, a breakdown below $217 may put Solana price at risk for $212 and $210 zones. Alternatively, if the level holds, the chart would indicate a probable rebound to form a “W” shape, which could initiate a move towards $226. This would show renewed bullish momentum following a short-term flush.
Meanwhile, traders are cautious amid liquidity tightening ahead of major U.S. events. Solana’s intraday trend remains neutral, while volatility is building. The upcoming ETF decision, scheduled for October 10, could amplify price swings, setting the stage for either a strong breakout or a deeper correction.
Solana ETF Decision Expected to Drive Institutional Flows
According to CryptosRus, JPMorgan expects inflows of about $1.5 billion in Solana ETFs during the first year if approved. Though smaller than Ethereum‘s expected volume, the inflows would mark Solana’s entrance into institutional markets.
However, continuing issues with U.S. government funding may delay the SEC’s approval process. Despite that, analysts continue to give a 95% probability of approval for the Solana ETF, along with strong filings from Grayscale, VanEck, Bitwise, and Fidelity. If it is cleared, the move could accelerate Solana’s market adoption.
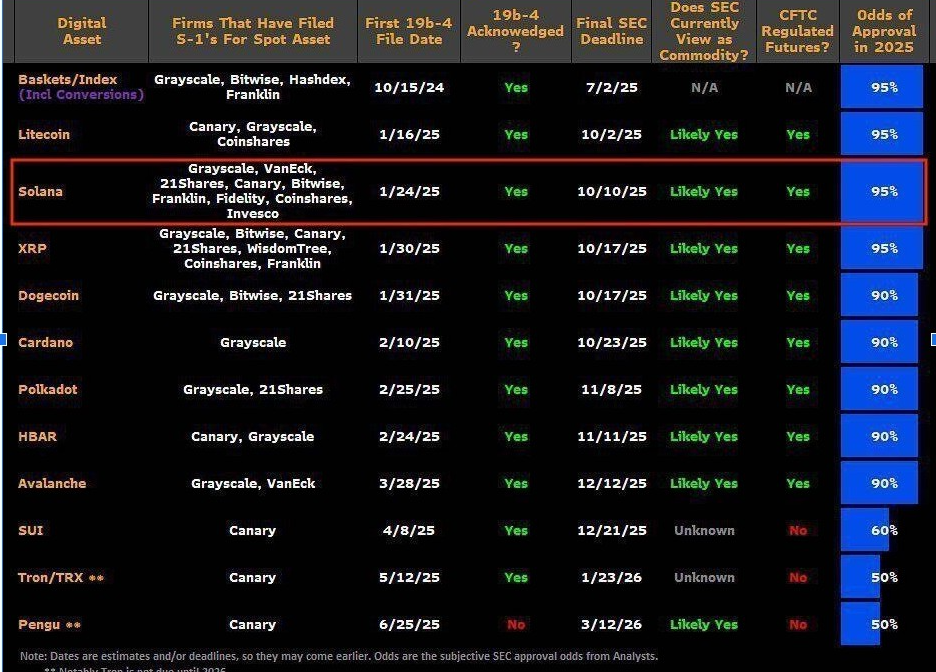
The ETF optimism has given long-term investors confidence that Solana is an emerging institutional asset. This structural development lends credibility to its position within the top blockchain networks, thereby enhancing exposure to investors and improving liquidity prospects. The ETF decision remains a key driver in the Solana price trajectory in Q4.
BNB’s Path Suggests Solana Could Mirror Its Rally
Meanwhile, analyst Crypto Rover compared Solana’s chart with Binance Coin (BNB) and showed strikingly similar accumulation patterns. He detailed how BNB’s breakout from a cup-and-handle pattern triggered an explosive move above $1,000, and Solana appears to be nearing the completion of a similar pattern.
On the Weekly time frame, the Solana structure is similar to the pre-breakout phase of BNB, pointing to a potential move in the $400-$500 range if things unfold as predicted. Rover believes Solana is “set to follow BNB’s path,” as it shares technical similarities and is building a growing institutional narrative.
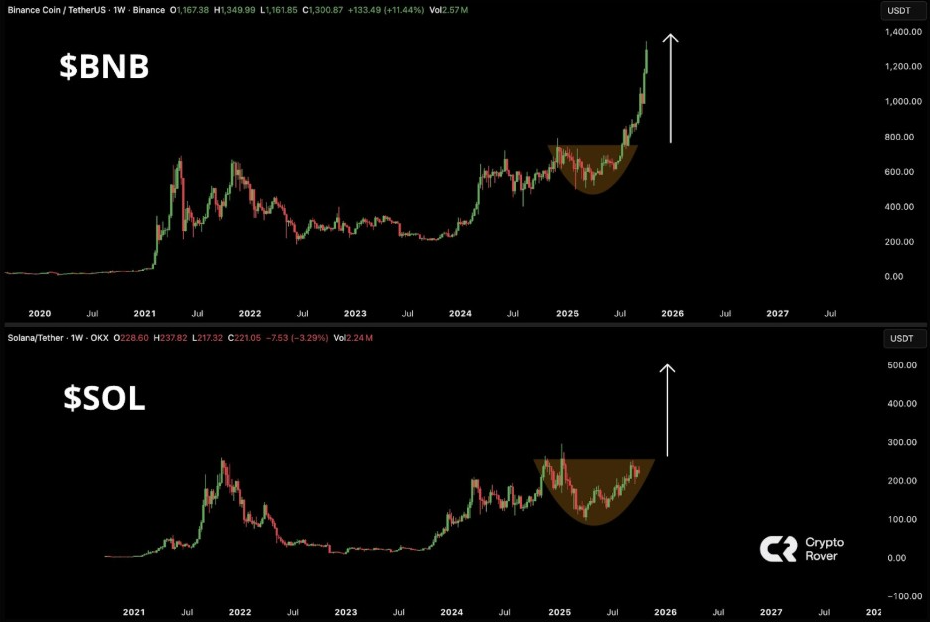
This comparison provides further evidence of Solana’s long-term bullish trajectory, despite some short-term volatility. Given the historical correlation between Solana and BNB, which exhibits similar patterns, the performance of Solana following accumulation is likely to be comparable to that of BNB, indicating the onset of a new phase in its market cycle.
Solana Forms Bullish Pattern as Bulls Target $253
BitGuru also noted a bullish setup on the 4-hour chart, labeling it a “healthy pullback” before a potential continuation. The price is currently consolidating around $226, and a breakout above $240 would set the stage for a breakout towards $253.
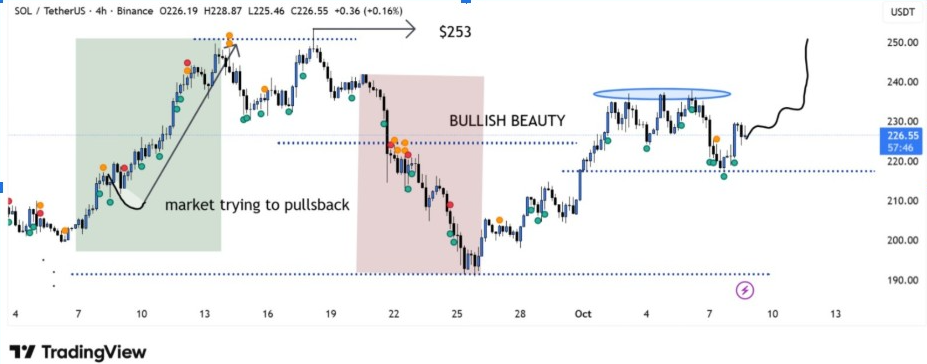
He said Solana’s market has defended the $220-$222 range multiple times, suggesting strong absorption by buyers. The RSI indicator showed the momentum building, which is in line with a possible reversal setup. If Solana price clears $240, it may confirm the pattern and bring bullish sentiment back on track.
Despite the brief corrections, Solana is still showing higher lows, confirming a constructive structure. The upcoming ETF ruling could be the catalyst to confirm this bullish scenario, aligning the technical and macro triggers.



