Bitcoin
 Solana
 Pearl
Pearl Zerebro
 Aerodrome Finance
 LayerZero
 NEAR Protocol

Solana news is topping trends as whales accumulate approximately 24.5 million SOL. The whales accumulated at roughly $189. This has formed a dense cluster of cost-basis orders, serving as a vital support level to Solana.
The tooltip displays a price range from $189.97 to $190.85. This range is calculated based on the cost basis. This Solana heatmap spans the period from late July to October 26, 2025.
Solana Whales Anchor Support at $189
In early August, the allocation is scattered. It ranges from the upper $160s to the mid-$170s, and prices fluctuate at lower levels. By late August and early September, prices rise into the $180s. The first signs of a solid belt are in the high $180s.
The belt becomes prominent from September 11 to September 20. This is where the Solana price catches up with the $200 to $220 zone.
At a spot price above 200, the distribution is still thickening between about $186 and $195. This indicates a more stable addition of holders with average costs just below the spot price.
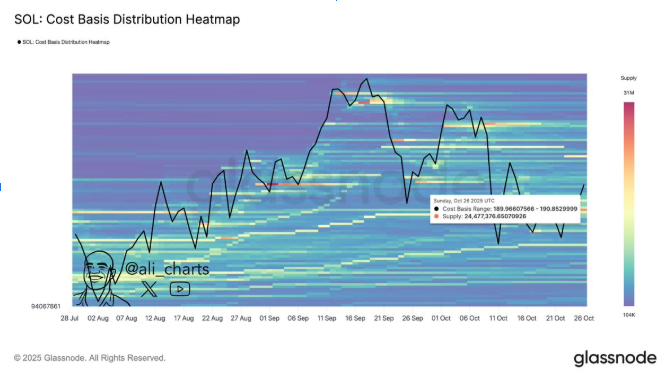
A price roll-over occurred at the start of October. It followed a shift from the final week of September, as noted in recent Solana news. The heat is increasing in the $189 to $191 range as the price moves back to the 190s.
The data features a continuous, lighter line that contrasts with the rest. They are much thinner and placed at the top and bottom. This is accompanied by a fall in mid-October, within the range of the higher and lower price limits.
This can be seen from the drawdown around the price line between October 14 and October 18. It rebounded sharply to the higher side of the price line, around the 190s, on October 26.
There is an ample supply concentrated within the entry band. When prices pull back to this zone, buyers often step in. These buyers are motivated by their break-even levels, which guide their decisions. Persistent movement below it may reverse and transform the area into resistance.
Solana News: Whales Continue Piling SOL
Single whale-tracking alerts show a whale that has liquidated an ETH five-times-levered long at a gain of 1.63 million. The whale then added a Solana ten-times-levered long.
This flow is not indicative of further results. However, it coincides with the on-chain chart, which shows increased interest around the $189 area.
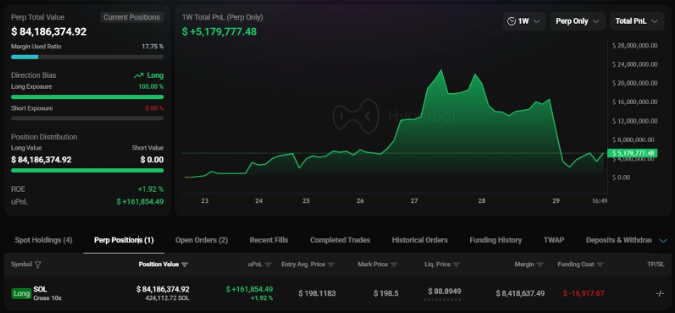
The timing is essential as this positions the large participant at the point where the cost-basis belt is thickest. Bitwise purchased 246.95K $SOL, valued at around $48 million. This move highlights growing interest, making headlines in recent Solana news.
Prices Move in a Triangle Formation
Examining daily Solana price charts reveals a significant symmetrical triangle. The pattern has been growing since 2024. The bottom line is an upward-sloping support line, starting at the double-digit price in 2024.
It then proceeds into the upper 180s by the end of 2025. This places the structural base directly beneath the cost-basis belt indicated by the heatmap.
The apex descends from earlier bottoms and highs. It generated multiple reactions in the $220 to $ 260 range in the third and fourth quarters of 2025.
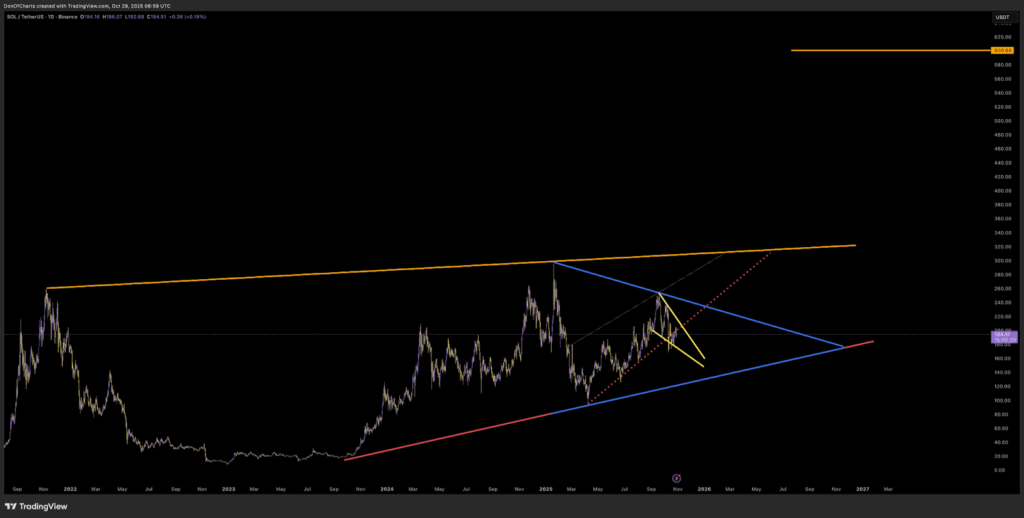
Long-range reference rails have also been retained in the chart. There’s a historical overhead guideline in the low-to-mid $300s range. A legacy extension marker also appears near the 600.68 level, as noted in recent Solana news.
These rails are more about contextualizing the present triangle’s location in a multi-year map, rather than projections. The first thing of immediate concern in the current analysis is the price location.
The indicator shows that Solana is trading between $194 and $195 at the time of capture. This is slightly higher than the $189 activation highlighted by the on-chain data.
The chart’s structural support aligns with the low-cost basis seen on the heatmap. This confirms the importance of the $189 to $191 price level.