
 Bitcoin
 Solana
 Pearl
Pearl Zerebro
 Aerodrome Finance
 LayerZero
 NEAR Protocol

Chainlink price is stuck in a bear market after plunging by over 38% from its highest level in September during the ongoing crypto market crash. LINK could continue falling the near term after forming at least two highly bearish patterns on the daily chart.
Chainlink Price Technical Analysis Points to a Steeper Crash
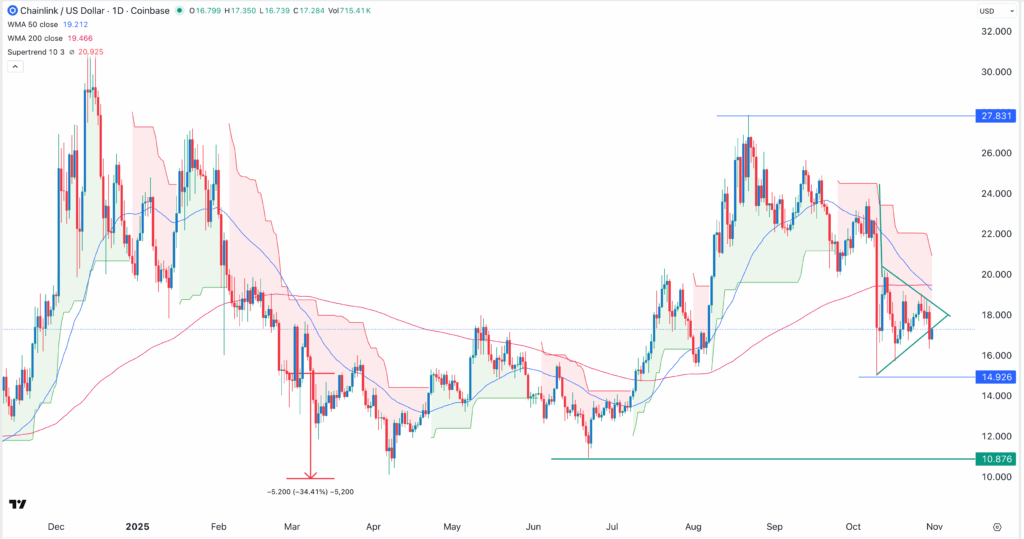
The daily timeframe chart shows that the LINK price has been in a strong downward trajectory over the past few months, moving from a high of $27 in August to its current level of $17.
The daily timeframe chart shows that this crash could accelerate in the coming weeks as the token has formed at least two highly bearish chart patterns.
One of these patterns is the bearish pennant, which consists of a vertical line resembling a flagpole and a symmetrical triangle. It has moved slightly below the triangle pattern, a sign that it has confirmed the bearish outlook.
The LINK price has also formed a death cross pattern, as the 50-day and 200-day Weighted Moving Averages (WMAs) crossed each other on October 28. This pattern often triggers more downside by confirming the short-term momentum.
The Chainlink token formed a death cross lastly in February, when it was trading at $15.7. It then plunged by over 30% after that.
The opposite of a death cross is a golden cross, which the coin formed lastly in July before a strong surge happened.
Other indicators suggest a potential Chainlink price crash in the coming weeks. For example, the token has moved below the Supertrend indicator, which has been in the red section since September this year.
Oscillators such as the Relative Strength Index (RSI) and the MACD indicators have continued to fall this month.
Therefore, the token is likely to experience a strong bearish breakdown, potentially to the next key support level at $14.2, which is the lower side of the bearish pennant pattern. A move below that level will indicate further downside, potentially to the psychological level at $10, which is the lowest swing point in June this year.
The bearish LINK price forecast will become invalid if the token moves above the key resistance level at $20.
Chainlink Network Fees Dropped in October
The primary reason the LINK token may drop soon is that the cryptocurrency market is experiencing a crash, with Bitcoin also approaching the death cross pattern. Such a move will lead to move downtown among the broader crypto industry.
Another reason is that the amount of fees that Chainlink collects from its users bucked the trend and crashed in October.
Data compiled by DeFi Llama shows that the fees dropped to $383,696 this month, down from $431,198 in September. This decline bucked the trend, as the fee had been in an upward trend since June, when it bottomed at $205,000.
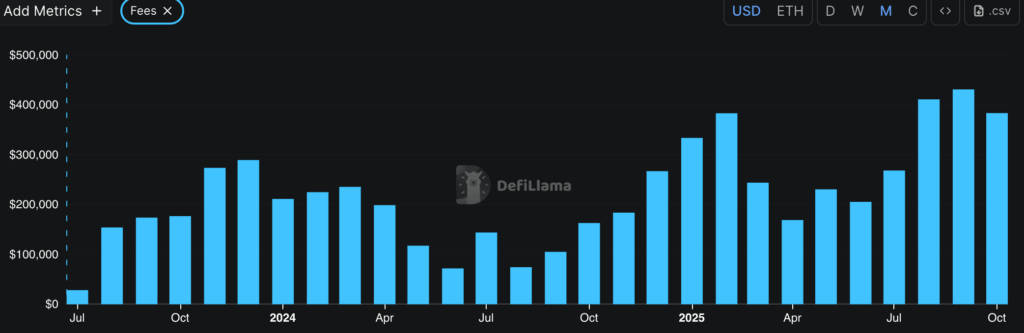
The falling fees mean that activity in the network dropped a bit in October during the crypto crash. It also means that the developers will scale back additions to the Strategic LINK Reserves, which it launched in October.
Chainlink buys LINK tokens using the on-chain and off-chain fees it generates. Data shows that the amount of reserves in the network has increased to 651,086 tokens, currently valued at over $11.2 million.
Potential Catalysts for LINK Price
Still, several catalysts may help to offset the potential LINK price crash. For example, the Securities and Exchange Commission will likely approve LINK ETFs in the coming months, which may lead to more demand.
The coin may also benefit from ongoing partnerships with some of the world’s largest companies. It already has partnerships with firms like Coinbase, UBS, JPMorgan, and Swift.
These partnerships have made it the biggest oracle in the booming Real-World Asset (RWA) tokenization industry. Data shows that assets in the RWA industry have increased to $35 billion over the last 30 days, while holders have risen to 523k.



