Wisp
Wisp Doge Pepe
 Zylo Ecosystem
 Crawlerpad
 Basic Attention
 Pearl
Pearl Quantus

Sui price showed signs of reversal after weeks of correction. Analysts are now indicating a potential buy signal near $2.10. The setup indicates that a potential bullish breakout is imminent in SUI price prediction.
Sui Price Forms Buy Signal After Sharp Correction
Sui price is getting renewed momentum as the TD Sequential indicator gives a fresh buy signal. Analyst Ali Charts had explained that this signal was previously labeled as the October 7 market top. The same tool is now pointing to the potential end of the recent downtrend.
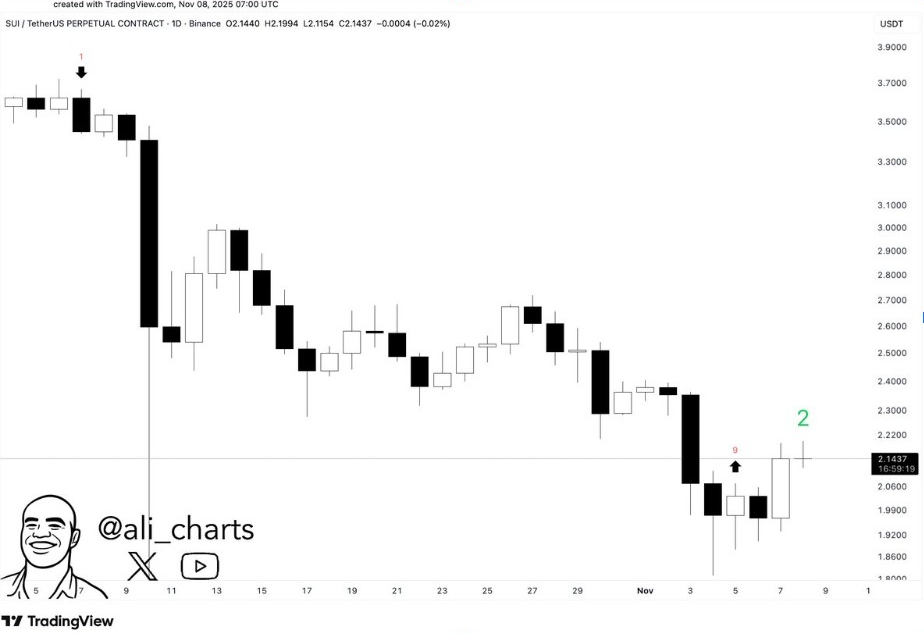
The SUI price is currently trading at $2.14, having established a solid base after retesting $2.00 multiple times. The pattern exhibits a series of higher lows, typically indicating the early stage of a reversal. If the price closes above $2.25, bulls could aim for the next level at $2.40-$2.50.
The uptick in volume backs this reversal outlook. Buyers are becoming more active as confidence increases around the $2.00 level. If the momentum persists, SUI price may regain bullish strength in the short term and confirm a change of trend on a daily chart.
Analyst Sees 400-500% Potential Surge
Analyst XForceGlobal detailed a broader bullish scenario for SUI using the Elliott Wave Theory. According to the chart, the token could be completing wave E before beginning wave Y. This setup could produce a 400-500% move if conditions are right.
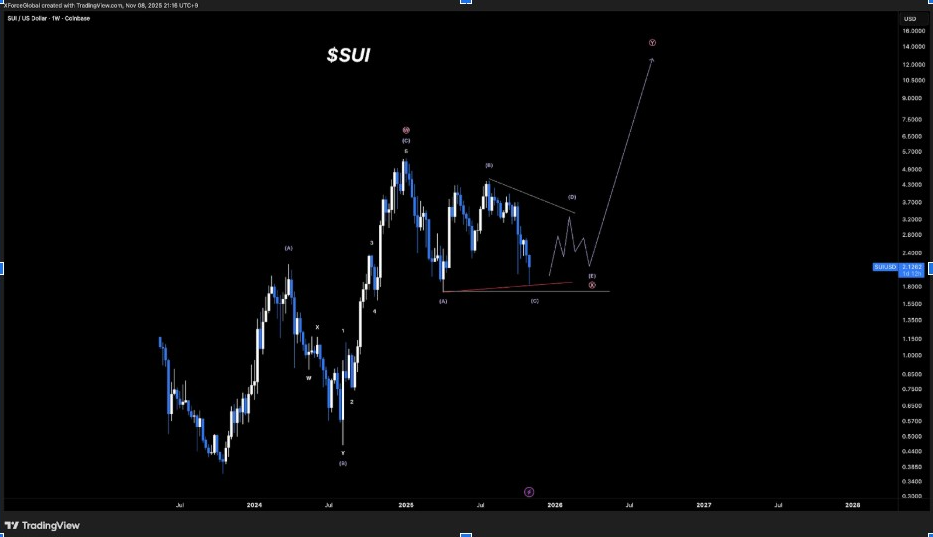
The analysis shows a healthy macrostructure, despite recent weakness. XForceGlobal believes that SUI could consolidate between $1.90 and $2.30 before moving higher. The wave count suggests a possible long-term recovery cycle after the correction is completed.
Historical patterns in such setups support this expectation. Many Layer-1 tokens have been deceived with explosive movements after consolidating for months. If the pattern holds, $10-$12 for SUI price could eventually be retested in the medium term.
Buyers Target $2.20 Breakout
Analyst James Easton said SUI crypto is “bouncing perfectly” off its support area around $2.10. His chart showed a large descending triangle with a strong area of resistance between $2.20 and $2.30. A breakout above this zone could be a technical trend shift.
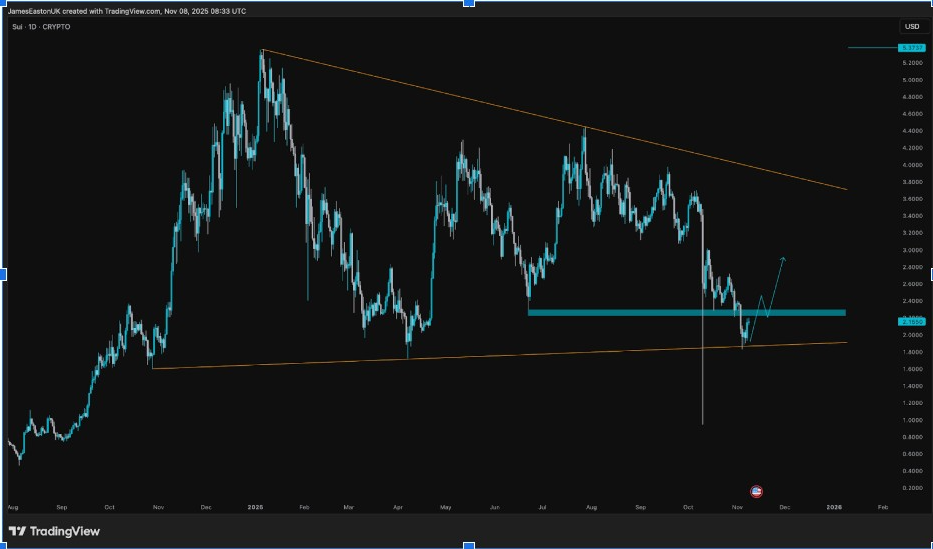
The pattern indicates that SUI price is compressing between support and resistance very tightly. Sustained closes above $2.20 and may open up to $2.80. The above chart indicates that the early momentum suggests the buyers are regaining control of the short-term structure.
Market sentiment is slowly improving. Open interest and trading volume have both increased since the bounce. Traders are now watching closely for confirmation of a breakout beyond $2.20 to confirm the next move higher.
Heavy Sell Walls Near $2.44 Could Slow Recovery
Meanwhile, analyst CW noted that SUI price has three important sell walls at $2.44 as the next zone of resistance. These levels match past profit-taking areas, which can serve as a constraint for near-term upside.
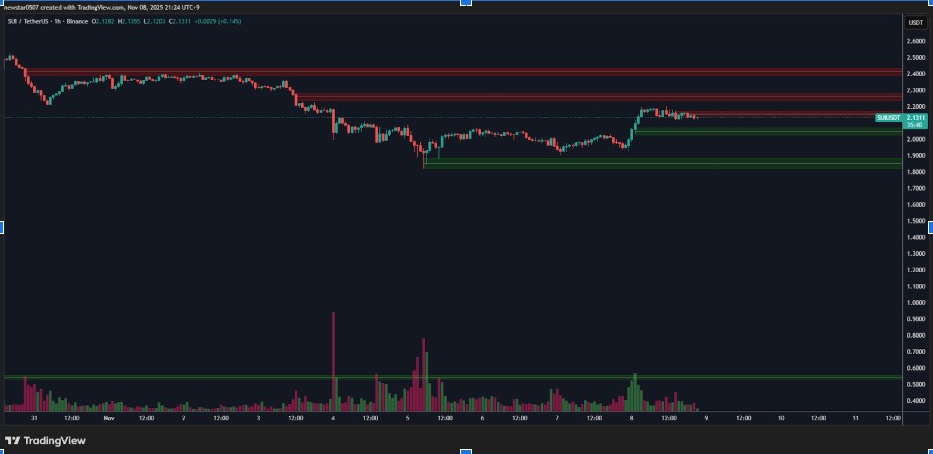
The lower support remains around $1.95-$2.00, where demand has been consistently demonstrated. The chart showed weakening selling pressure on the price, stabilizing above $2.10.
The decreasing exchange reserves add further weight to this bullish scenario. Fewer tokens on exchanges often indicate less selling risk. However, if the resistance level of $2.44 is not breached, another short pullback could occur before another recovery attempt.