
 astronaut
 Pearl
Pearl NEAR Protocol
 Starknet
 Zcash
Zcash Pudgy Penguins
 Ethena

Chainlink price is nearing a key reversal point after testing a long-term ascending support line. Analysts think this level may lead to a major recovery back towards $26 or even $47 if buying momentum mounts. Technical independence and structure of the market show early signs of renewed strength after weeks of decline.
Chainlink Price Tests Launchpad Support Zone
Analyst Ali explained that Chainlink price has reached a critical trendline historically responsible for triggering massive upside movements. His chart identifies the area between $14.5 and $15 as the key retracement zone that is in line with the 0.618 Fibonacci level.
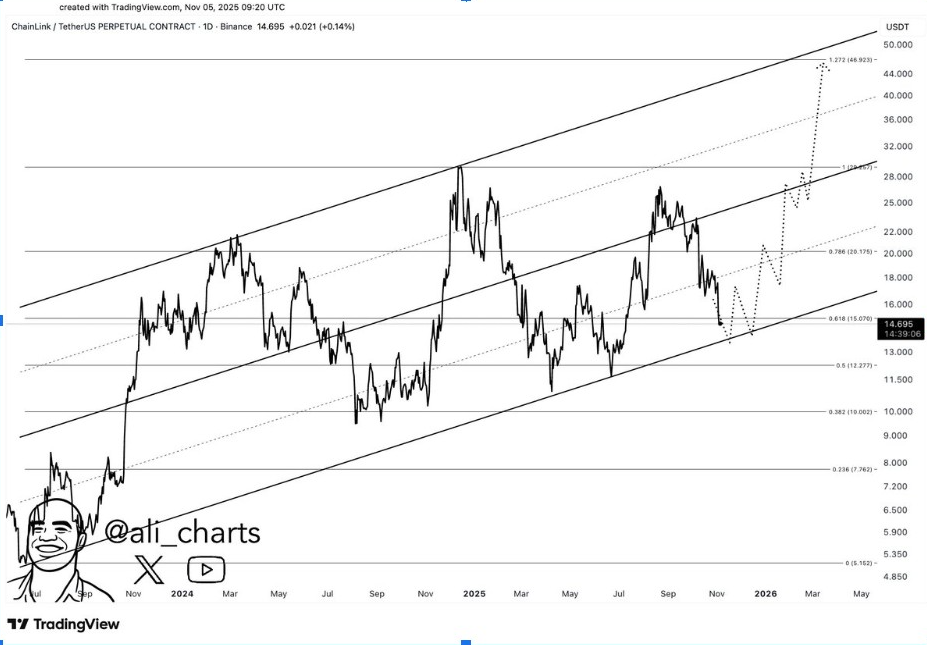
According to Ali, a clean bounce from this band could begin a new medium-term advance. The projection shows potential upside targets at $26 and $47 if bulls stay in control. This configuration resembles the rebounds from the same structure in 2022 and 2023.
He added that holding above $14.5 does not break the broader trend. The zone serves as a “launchpad” on which new demand can emerge. Failure to defend it may have the effect of delaying the next impulse, but on balance, sentiment is constructive.
Long-Term Structure Indicates Multi-Year Breakout Setup
Analyst James Easton provided a macro chart of LINK trading within a large symmetrical triangle. He said the compression between rising support and falling resistance was suggestive of an explosive move ahead.
Easton’s projection puts the next breakout zone at $20-$23. Above that range, the pattern may be rapidly expanding to $30 and $50. This structure has taken two years to mature, often resulting in sharp directional bursts after resistance breaks.
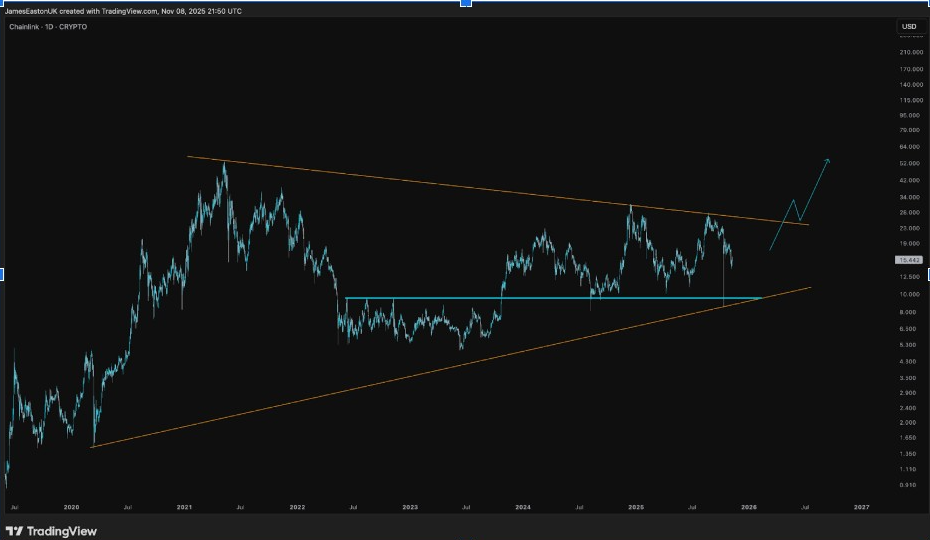
He also noted that LINK price has placed regular higher lows since 2022, suggesting quiet accumulation. Easton said such behavior was often followed by sustained rallies fuelled by renewed investor confidence.
The chart also showed a tightening of the volatility, which usually precedes massive breakouts. Easton said that after the move is done, “we’ll look back and laugh at today’s prices,” signaling optimism across long-term holders.
Daily Outlook Shows Indecision but Favorable Bias
CryptoWZRD noted that current LINK candles were not trending, and there was indecision after a couple of days of choppy trading. He wrote that a better breakout signal is required before a strong directional lead is formed.
The analyst made $16.9 to be the critical short-term trigger for a bullish extension. A move above that level could push the price to $20, which is the next area of resistance. Below $15.4 LINK is allowed to retest its base before further climb.
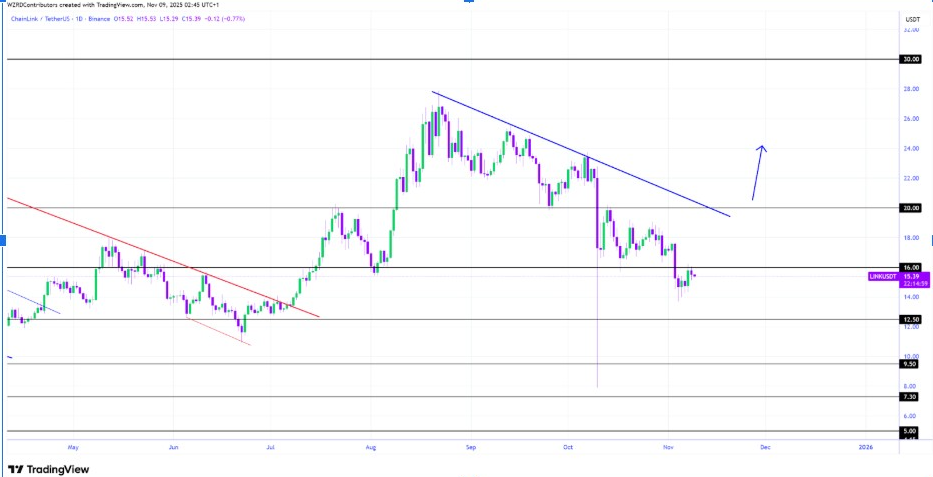
On intraday charts, LINK is still trading sideways under a descending trendline. A breakout through this line would unleash upside momentum. CryptoWZRD highlighted the importance of patience and that strong continuation waves often follow consolidation phases.
Volume is still moderate but showing early upticks with each rebound attempt. This represents a possibility of gradual positioning in front of a possible directional push. Once confirmation arrives, LINK could continue to extend toward $20-$22 in the following sessions.
Wave Count Suggests Bottoming Pattern Taking Shape
Analyst Man of Bitcoin used the Elliott Wave analysis to depict a forming reversal formation. His chart showed LINK price in a completed two-phase corrective wave, from which three advancing waves are now forming from the lows.
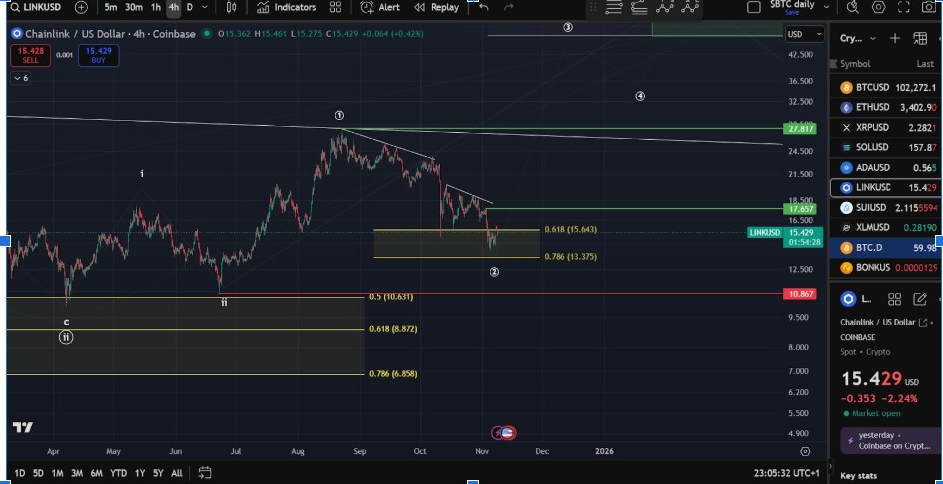
He said that a break above $17.65 would validate the beginning of a new impulsive cycle. This zone is associated with strong horizontal resistance and prior supply pressure. Getting rid of it could confirm a sustainable bullish transition.
The 4-hour chart supports this theory and shows higher lows above the 0.786 Fibonacci retracement around $13.3. As long as the price remains above this band, upside prospects are intact.
Man of Bitcoin pointed out that there is a recovery in momentum oscillators from oversold levels. At current conditions, targets of $27.8 might be reached by early 2026. His outlook agrees with Ali’s long-term trendline thesis and reinforces the possibility of a multi-month uptrend.




