
 no crying in the casino
 NEAR Protocol
 Starknet
 Pyth Network
 Pearl
Pearl Quantus
 Pudgy Penguins

XRP price is showing some strength as it holds onto a key range above long-term resistance zones. Liquidity indices also show a highly skewed market structure.
XRP price is currently at the hold levels on the daily chart, as it was before its market rally in November 2024.
Technical evidence on various timeframes now suggests that the asset may be gearing up for another structural shift. This can be inferred from the current momentum consolidating around key support areas.
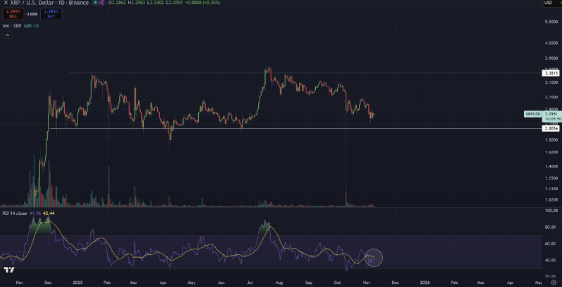
The Relative Strength Index (RSI) is currently around 42-44. This is similar to November 2024, just before XRP rose over 80% in three weeks. This RSI arrangement has traditionally signaled the end of downtrend periods for XRP.
This was observed in similar momentum resets in December 2023 and July 2024, preceding upward moves. This took the asset above previous levels of resistance, supporting the relevance of existing signals.
Liquidity Map Shows Imbalance Favoring Upside
Additional charts on volume profile and liquidity data suggest that there are strong bands of liquidity above the current price. This ranges from 2.60 to 3.40. Liquidity is not high below 2.00.
This distribution means that the sell orders are concentrated more at the top. On the other hand, the support is not quite so concentrated. This usually facilitates the quick ascent once momentum develops.
The volume histogram also highlights a large volume node at equilibrium at the current level of approximately 2.30. The following essential volume nodes can be observed at approximately 3.00 and 3.38.
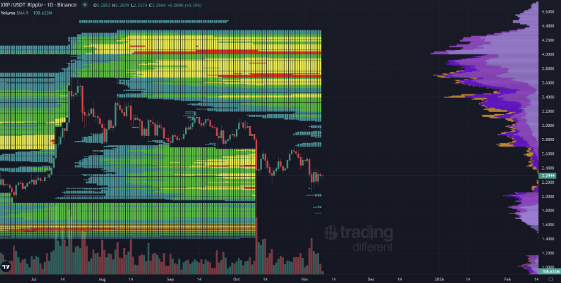
Thin liquidity of the market at a price below indicates that the downside risk is relatively low. An upside move may occur rapidly if XRP rebounds to a price level above $2.60.
Weekly Chart Confirms Structural Break Above Multi-Year Resistance
XRP price is holding firm above a seven-year resistance zone between $1.80 and $2.00. The range repeatedly capped rallies since 2018. The successful weekly close above this level in mid-2025 confirmed a major structural breakout.
This asset has since managed to defend during recent corrections. The weekly RSI, now hovering around 43–53, aligns with conditions last seen just before XRP’s breakout in late 2024.
This alignment suggests that the weekly RSI has returned to the level we observed before initiating our last update in November.
Historically, re-tests of long-term resistance after breakouts often form strong basing structures. These structures typically support higher moves when momentum returns.
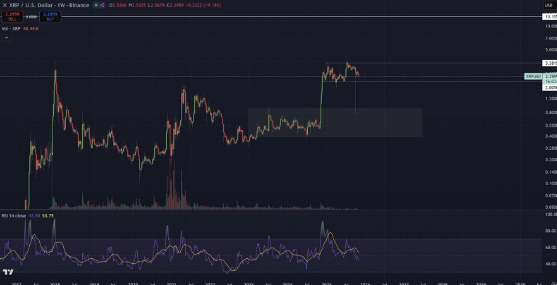
Additionally, volume behavior has normalized following the summer surge, with no signs of major distribution. This suggests that the ongoing consolidation is corrective rather than trend-ending. This maintains the overall bullish market structure above $2.00.
XRP Price Dominance Chart Completes Wyckoff Accumulation
XRP price Dominance shows that over the last two years, XRP formed a textbook Wyckoff accumulation form. It went through Preliminary Support (PS), Selling Climax (SC), Secondary Test (ST), and Spring.
This happened before transitioning to the Sign of Strength (SOS). The last Point of Support (LPS) was the final phase.
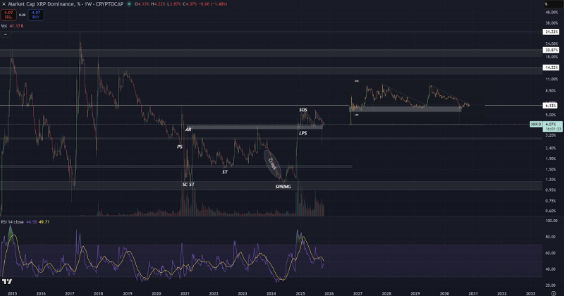
The current arrangement indicates that XRP holds approximately 6.1% market share in the area. The token left the Spring cycle at an earlier stage in 2024. The new stabilization points to a likely uptrend.
If dominance stabilizes around this point, it may be a sign of a new round of relative performance for XRP.


