Dacity Coin
 Pearl
Pearl Bitcoin
 Injective
 Pudgy Penguins
 Quantus
 Starknet

PEPE price is under heavy pressure after confirming a major bearish technical pattern on the weekly chart. Market data indicated falling demand, a lack of momentum, and increased supply concerns across the various exchanges. Analysts say conditions are tenuous, with PEPE trading near a vital multi-month neckline.
PEPE Price Breaks Neckline After Bearish Pattern
Ali Charts showed that PEPE price confirmed a clear head and shoulders structure on the weekly timeframe. He pointed out that the break in the neckline triggers a measured target of almost $0.00000185.
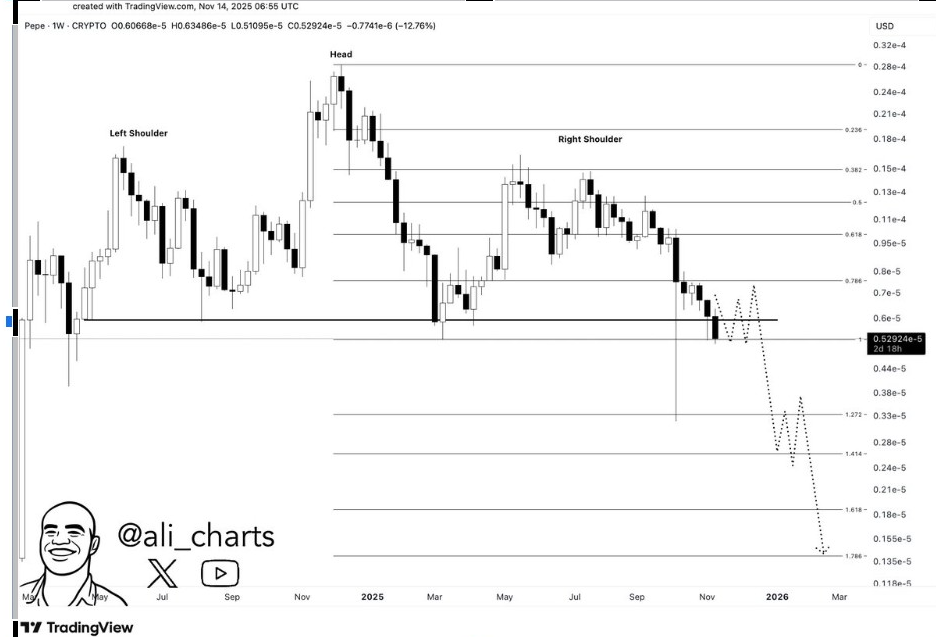
His chart displayed the formation of the left shoulder in the early part of 2025, followed by a steep rally that formed the head. The right shoulder was a lower high signalling weakening bullish strength. Price then broke the neckline with strong momentum, forming a fresh wave of downside pressure. Ali added that failed retests could exacerbate weakness if sellers maintain control near the resistance level.
Fibonacci levels on his chart align with the projected drop. The pattern is indicating deeper retracement zones at the 1.272 and 1.414 extensions. His view stressed that technical exhaustion increases sharply each week. Momentum remains bearish, with volume confirming the trend.
Oversold Signals Appear but Trend Stays Weak
Similarly, Pepe Whale stated PEPE is still firmly in a downtrend. He emphasized that indicators point to an oversold reading, but they do not guarantee a reversal.
His chart showed a continual sequence of lower highs and lower lows on the daily time frame. The price is still below the swing structure and is showing respect for the descending resistance.
He added that market exhaustion typically precedes reversals, but new lows are possible. His post served as a cautionary tale for investors to be cautious about risk during periods of volatility.
Pepe Whale noted there is no clean long setup yet. He stressed that they can choose to accumulate with no stop-losses, but these are high-risk strategies. His analysis rests on the assumption that the current structure is unstable until a major market shift occurs.
Neckline Bounce Holds Yet Risks Remain
Furthermore, Chiefrat said the head-and-shoulders pattern almost broke last week, but the price bounced at the previous high. He warned that failure to hold this week could lead to a 60% decline.
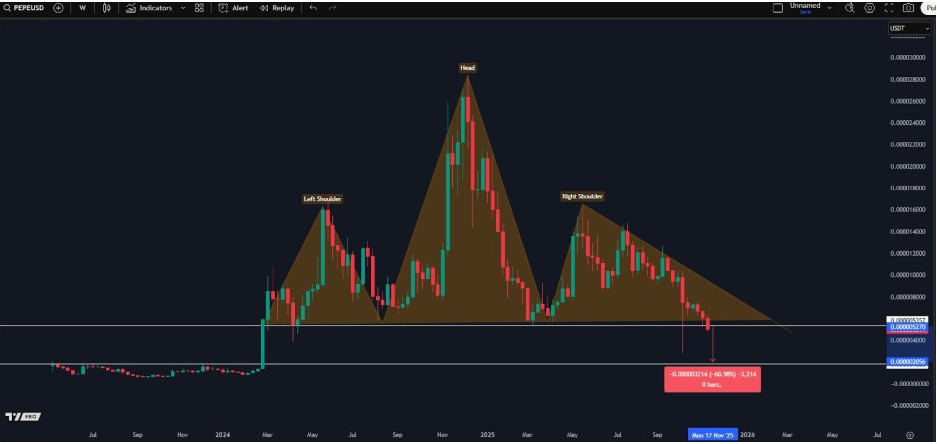
His chart showed the neckline acting as a temporary support level. The bounce saw a reprieve but could not alter the overall trend. Lower highs remain dominant, with PEPE still below key weekly resistance. His analysis showed weaker bullishness than in previous months.
Chiefrat added that the structure is similar to a classical macro distribution pattern. Price action remains a reflection of declining confidence by big hands. He noted that bears could regain the upper hand if the neckline breaks decisively. That failure would reveal the next major weekly support zone.
Sell Walls Build as Downtrend Strengthens
Meanwhile, CW identified three major sell walls that developed above the current trading range. These overhead zones create strong friction for any rebound attempt.
His intraday chart showed several red resistance ranges around $0.0000060, $0.0000056, and $0.0000053. Buyers face heavy absorption at every level, which stalls breakout attempts.
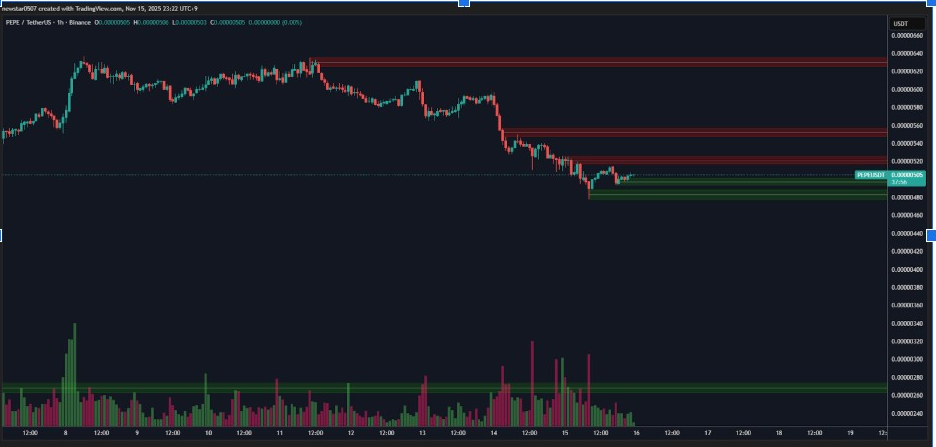
CW said the price is still confined between weak support and stacked resistance. Volume always increases during dips, suggesting persistent supply.
The chart also displayed demand zones of below $0.0000048 and $0.0000044. These zones may act as short-term buffers, but the structural weakness continues. CW said the PEPE has not demonstrated a decisive reclaim of lost levels. Without that reclaim, the corrective conditions can continue.