Zylo Ecosystem
 Walrus
 Bitcoin
 Sui
Sui Quantus
 Quant
Quant Starknet

The Chainlink price is set to face its most significant technical test in a year. LINK is currently trading on a long-term rising trendline that has seen key recoveries since July 2023.
LINK’s structure now stands at risk of losing a support trendline that has been holding strong since July 2023. This underscores the volatility of the current retest after weeks of diminished momentum.
Chainlink price has followed the trendline, which carries the July 2023 swing low around $5.50.
The trendline has acted as support during numerous rallies, including those in October 2023, March 2024, and June 2024. Every interaction resulted in a sharp upward trend, which created one of the strongest structural bases of LINK.
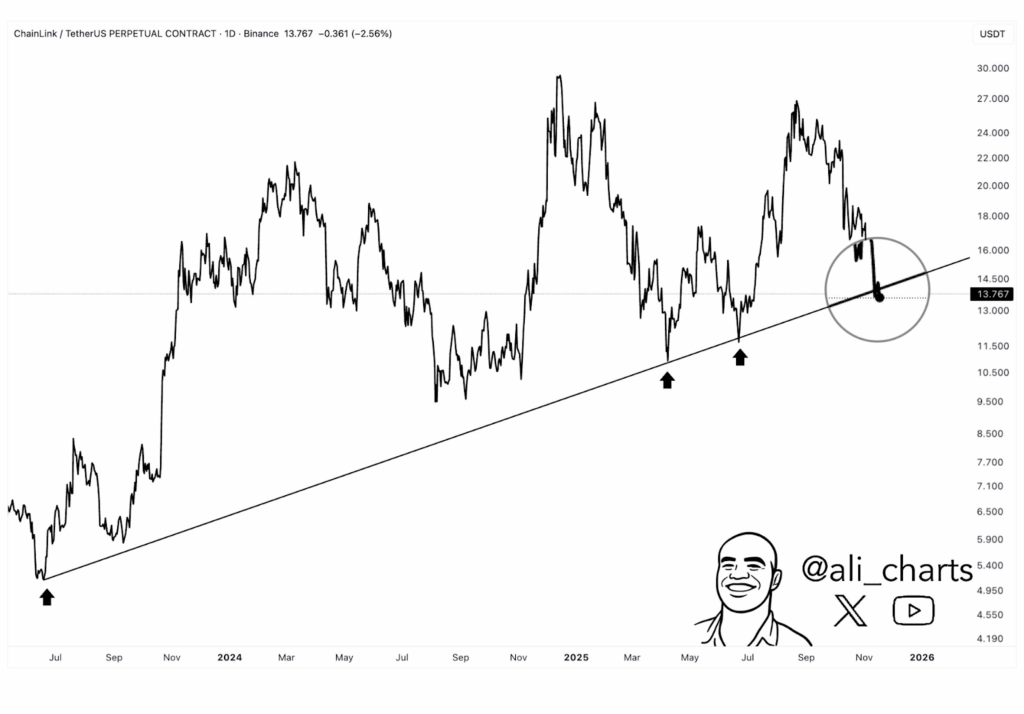
The most recent retest in mid-November 2025 indicates that the rise is tightening the screws between the price ranges of $13.70 and $14.00. LINK price is now trying to stabilize at the point after maintaining a steady fall since the $18.00 area.
The chart also shows the price slipping straight into the trendline, following an early-September high at a level of over $21.00. That high came after several months of recovery, starting in June 2025.
LINK later pushed up and failed during the months of August and October as price levels dropped to lower highs of around $19.00 and $16.50. The sell-off intensified further by the end of October. It created a decisive drop that took Chainlink price back to the trendline in four months.
Analysts Diverge on Timing But Highlight the Same Key Level
More charts reveal another descending-channel pattern, where LINK is in a very fine entry at the bottom of a falling channel. The channel stretches back to the middle of August 2025.
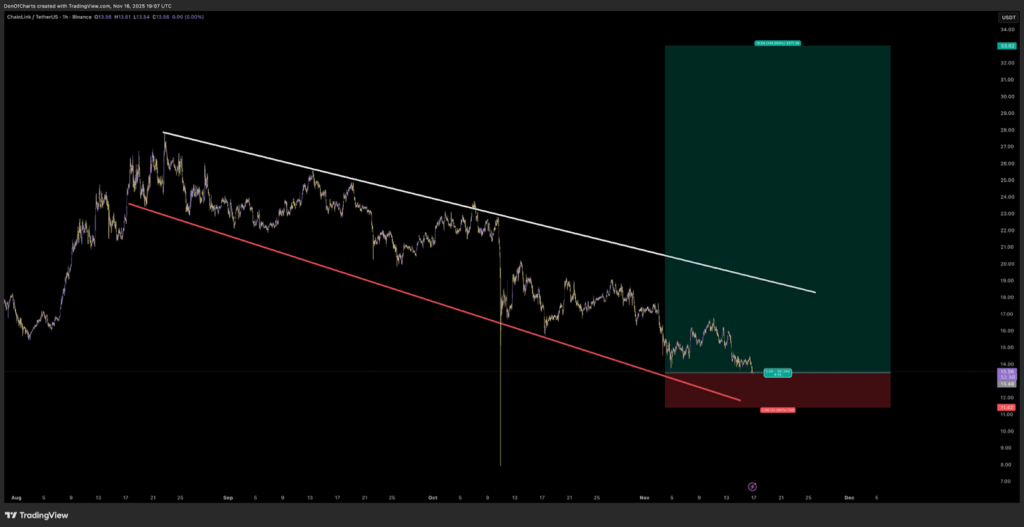
The intersection of the long-term ascending trendline with the descending-channel support and the long-term support zone shows the significance of the zone. A price gap between $13.20 and $14.20 has been used as a break-even point during several periods.
Chainlink Price Forming a Tight Range as Traders Watch $15.40
More daily charts indicate that the Chainlink price has shifted slightly bearish. LINK is trading within a specific range, capped at the resistance level of $16.00 and supported at $12.50.
The current situation of LINK depends on the possibility of regaining control over the immediate resistance beyond the long-term trendline.
The chart also offers an indication of a narrowing volatility market structure. Following the high of early September at about $21.20, LINK created a series of successively lower highs. Those actions reduced the momentum towards November.
The volume also decreased slowly. It indicates less involvement where the price was approaching a significant support level.
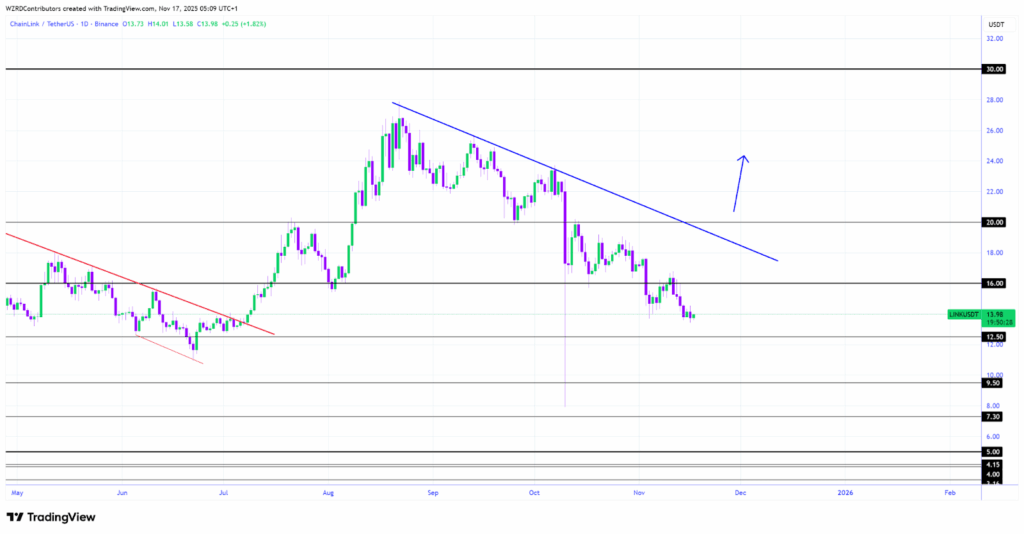
The lower range boundary at $12.50 has been validated several times. It served as resistance in May 2024. The boundary flipped to support in August 2024 and again in April 2025. This region is also in line with support in the previous chart at the lower channel.
The immediate resistance needed to reestablish the situation is $15.40. Any action through that level would bring Chainlink price back into the mid-range of between $15.40 and 16.00. The move would provide the bulls with a base to start attacking the downward trendline.