
 Pearl
Pearl Walrus
 Starknet
 Quantus
 Bitway
 Sui
Sui Zylo Ecosystem

Solana news is making rounds again as whales stack up, seemingly preparing for a major move. The action comes after several weeks of selling pressure that brought major liquidity levels under the Solana price. This leaves a cleaner structure to any possibility of recovery.
On-chain data shows that one newly created wallet, BRzF5F, removed 100,791 SOL, worth about $14.13 million, from Binance, Kraken, Bybit, and OKX. This kind of behavior is typically observed during periods when supply is dwindling in the exchanges.
It comes when the Solana price trades between the $130 and $142 range, the lowest since the beginning of the summer. SOL has already drained much of its downside liquidity after weeks of continued decreases. The whale flow coincides with the time when prices hit a technical inflexion point.
Solana News: Liquidity Heatmap Shows Broad Clearing of Downside Levels
Liquidity heatmaps between October 19 and November 18 depict how aggressively Solana’s downside zones were absorbed. Bright yellow and green liquidity pockets under the price slowly faded away, with the asset losing ground in the $180 to $200 region by the end of October.
The quickest liquidity clearing took place between the fall of November 3 and November 15. The heatmap indicates thin bands on several price layers.
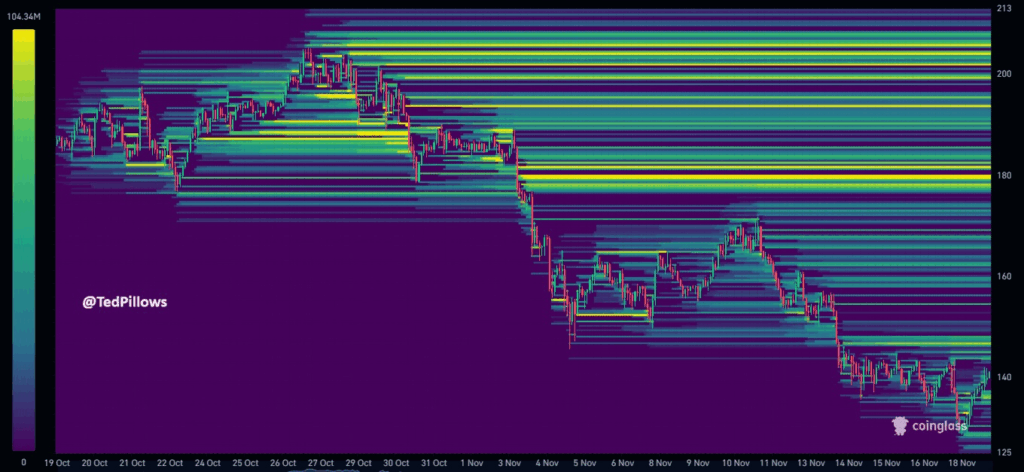
By mid-November, there was a significant decrease in liquidity density below the $140 level. This indicates that the market absorbed major orders during its downward slope. This aligns with the analyst’s evaluation that the majority of the downside liquidity available had already been taken off.
This type of structural cleanout often resets the market. It removes accumulated sell-side friction that developed during earlier consolidation phases.
Healthy liquidity groups around the Solana are between $170 and $200. These bands create the most vivid overhead structure. The zone could serve as an absorption point or a consolidation area.
Chart Structure Shows a Clean Sweep Followed by a Sharp Reaction
Chart data gives some background information on the Solana news about the recent fall and the response.
There is an Elliott wave structure that saw Solana drop off the highs of its early-autumn swings, reaching the $210 to $215 range, and then form a series of lower highs in September and October. Intermediate support at $178, and the 158 were broken in this sequence.
The most recent stage of the downturn had Solana price falling to the $130 area. The low might be the most ideal response so far. Candlestick activity on this level reflects an apparent rebound wick, thus demonstrating the existence of urgent demand.
This reflects the past reactions in July, when Solana last retested similar levels. The Solana price then momentarily held steady before making progress.
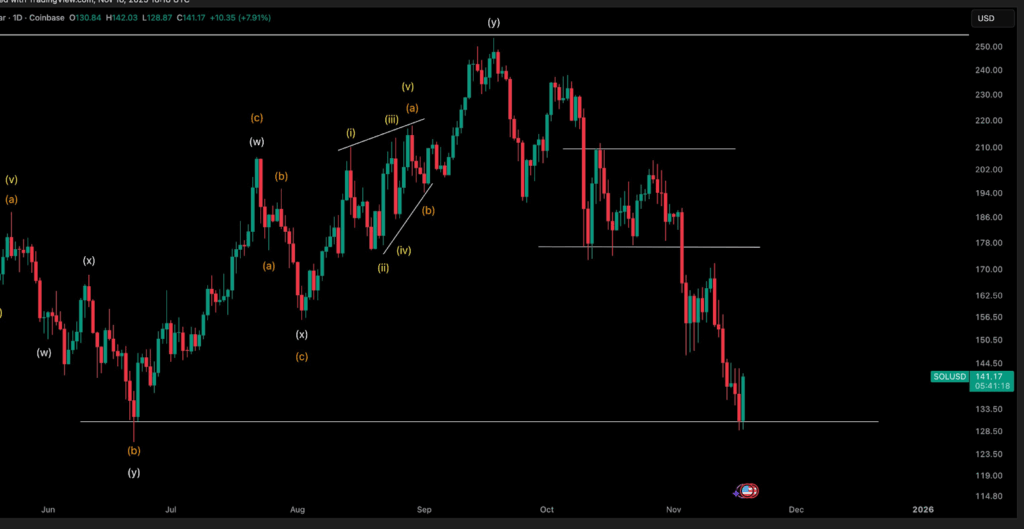
The chart illustrates key chronological features of this cycle. These include the consolidation in October and the acceleration of selling pressure between November 3 and November 11.
We also see a stabilization zone between November 15 and November 18. These timestamps correlate with the clearing cycle of the heatmap and the whale withdrawal event, which connects several datasets to indicate a likely structural reset.
Combined, the charts and whale activity provide a uniform view of a market that has been subjected to significant downside pressure.
The disappearance of significant bands of liquidity beneath the Solana price, the recovery of a clean structural sweep, and the emergence of large accumulation activity are all indicators of why the current phase is different from the previous decline.



