
 astronaut
 Zylo Ecosystem
 Pearl
Pearl Sui
Sui Walrus
 Quantus
 Quant
Quant

PEPE price is nearing a critical reversal zone after a steady decline for weeks. Several analysts are now seeing a possible rebound in the making as technical patterns narrow. Market conditions are still fragile, but the most recent charts are showing early signs of momentum returning.
PEPE Price Near Key Breakout Zone
The PEPE price is trading around a long-term support zone, which has capped several falls this year. The structure now has the shape of a falling wedge, which is often a trend exhaustion pattern. Price action is closely tied to the lower boundary, where liquidity usually accumulates before strong reactions occur. Analysts have reasoned that the compression near this region leads to a higher likelihood of a sharp move.
The weekly chart indicated PEPE price defended a significant level of horizontal support, and buyers gradually absorbed the supply. Volume remains muted, but the structure is hinting that downside momentum is fading.
The market has respected this support on several occasions, making the current test particularly significant. If a breakout occurs above the trendline resistance, analysts believe PEPE price may rise rapidly.
Weekly Structure Signals Possible Recovery
One view from PepeCZ highlighted a broad wedge formation that persisted over several months. The chart revealed PEPE price making a complete cycle from breakout to retest, followed by a deep retrace into the wedge floor. The model forecasted a strong rally from the current zone, with the price recovering previous consolidation levels. The structure suggests a path to recovery and higher liquidity levels.
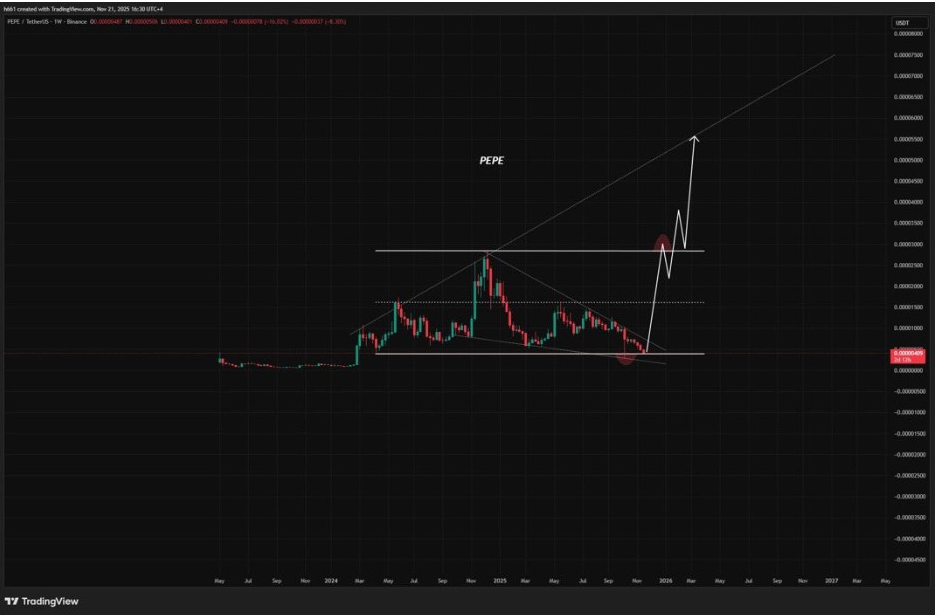
The projection indicated the formation of new impulse waves as soon as PEPE leaves the range of compression. PepeCZ expects the market to first stabilize and then break through to mid-range resistance. The chart also showed a potential reclaim over the previous horizontal barrier. A successful reclaim may address areas that were last seen earlier in the year, when bullish activity was at its peak.
Pattern Suggests Further Downside Before Rebound
Ali’s chart highlighted a completed head and shoulders structure, which traditionally shows further downside. His measurement indicated a target near $0.00000185 for a bearish case, a contrast to other analysts. The neckline has broken cleanly, and the price continues to trail lower beneath major Fibonacci levels.
According to Ali, the validity of the structure is terminated by PEPE invalidating the neckline with sustained recovery.
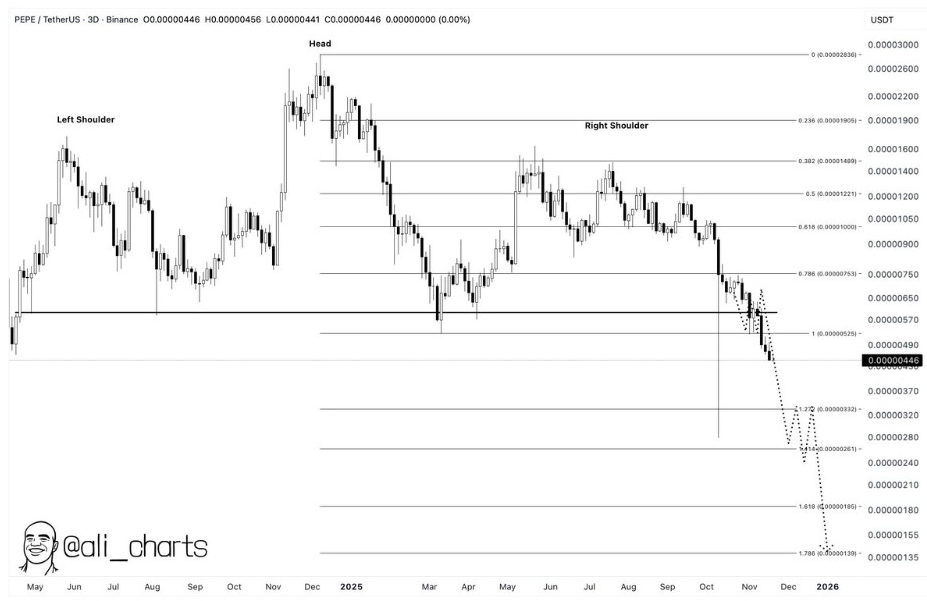
Even with the bearish target, the movement may run out of sellers around the lower Fibonacci extensions. In previous cycles, Ali notes, there have been steep declines followed by aggressive rebounds. The move so far has been similar to that behavior, although the risk continues to be high until buyers recapture some of the lost levels. If the price stabilizes close to the projected region, the next reaction could determine the medium-term trend.
Falling Wedge Highlights Breakout Potential
Meanwhile, PepeWhale spotted a falling wedge on the one-hour chart with repetitions of upper and lower trendlines. These types of patterns are usually seen at the end of a downtrend, especially volatile meme assets. The analyst shows support between $0.00000455 and $0.00000470, where volume has historically increased. A breakout above $0.00000490 would add to the case for a reversal.
PepeWhale also reviewed on-chain signals indicating an increase in RSI from oversold areas. The indicator makes a bounce on reaching extremes, which frequently results in short-term reversals. Volume behaviour is still important here, as low liquidity assets will need confirmation to declare the change in trend. The analyst points out that rallies of 10-20% are not uncommon when wedges break decisively, especially in favor of the market.




