Dacity Coin
 streamoors
 Celestia
 Injective
 Quantus
 Pudgy Penguins
 Pearl
Pearl

HBAR is showing potential reversal signals on both daily and weekly charts. Excitement around ETF developments is fueling this momentum. Despite this, the price action of HBAR stayed weak.
This raised questions about whether the power from the ETF inflows was enough to ignite a rebound. HBAR price action has been down by about 5% in the past 24 hours as of press time.
The weekly chart showed the same decline. The market fought to stay above $6 billion after days of outflows.
Bullish signals alone don’t guarantee a reversal while momentum remains weak. A broader crypto rebound will likely be needed to confirm sustained upside.
HBAR Price Shows Bullish Divergence
Starting with the daily price chart, there was a clear sign of potential bullish action. The market was forming lower highs and lows while the Relative Strength Index was rising. Normally, the two move in tandem, and their divergence suggests a possible shift in direction.
Even though the HBAR crypto was hitting lower levels, the recent bullish candles showed immense buying. This further affirmed that the potential reversal was on the way, but levels at critical zones needed to be breached.
For instance, flipping the zone between $0.20 and $0.23 would mean invalidating the current bearish structure.
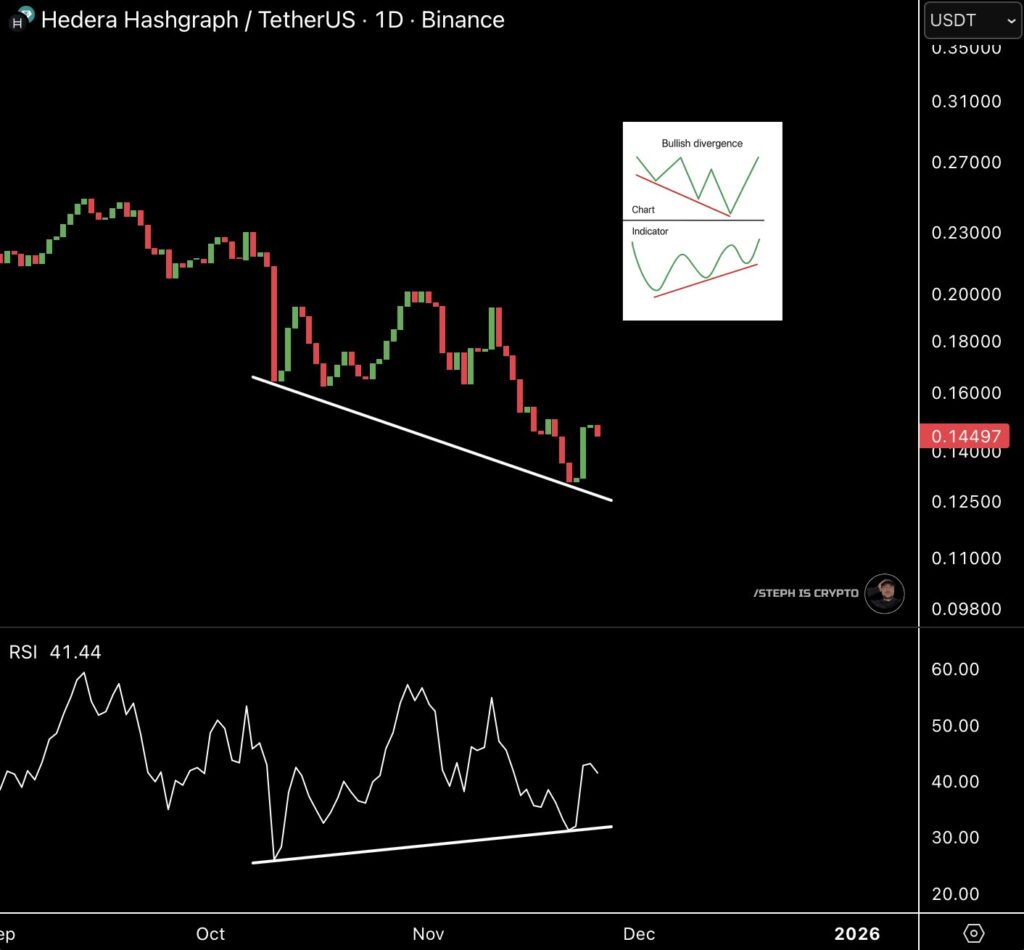
As traders saw this first bullish action on the daily chart, the bigger timeframes were also aligning. There was still a risk of further downside. Historical analyses show this signal often failed in extreme bearish periods.
Weekly Price Action Gives Another Hint
Every week, HBAR’s price action continued to show similar bullish trends. HBAR price action was trading just above a zone that has held the price above it since the beginning of 2025.
What was more fascinating was the fact that this timeframe printed a dragonfly-shaped Doji candle. This pattern typically indicates market turning points. However, the HBAR price needed to confirm this by breaking above $0.20 and $0.23.
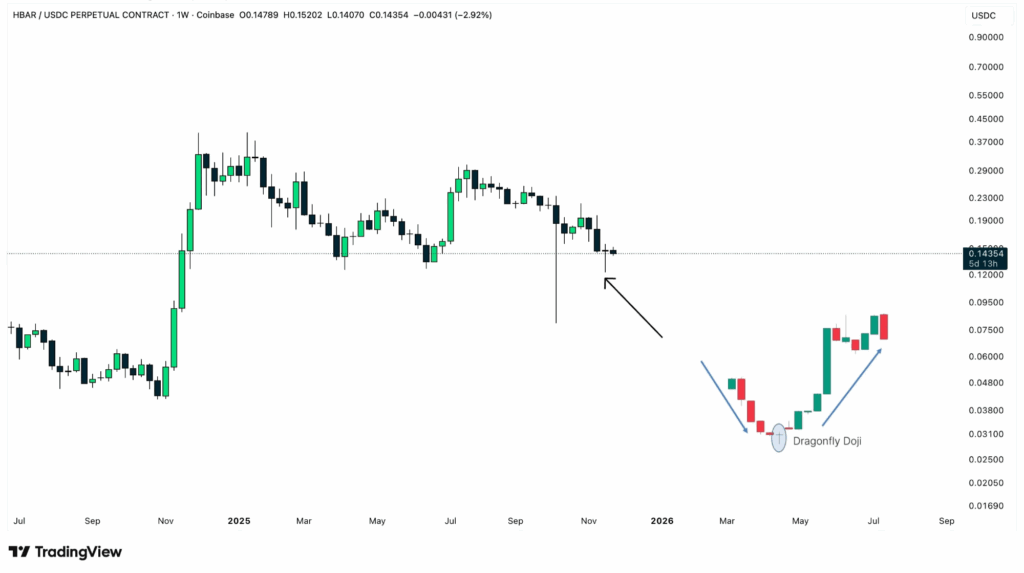
In case this last quarter changes in terms of direction, HBAR price could revisit levels at $0.40 or higher. The period has performed contrary to its usual historical bullishness when the year ends.
This could be attributed to the overly bullish trend throughout most of this year. That way, the prices of risk-on assets, including HBAR, saw this difference.
Canary Capital Adds ETF Holdings
In the meantime, as the price of HBAR showed these bullish signals, its ETFs were following this pattern. In particular, Canary Capital’s HBAR ETF increased more than the price of this underlying asset this week.
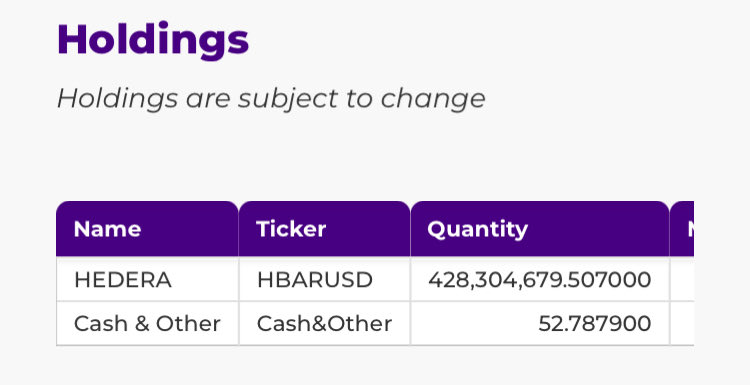
It bounced off from a $17.67 valuation as its holdings reached 428.3 million HBAR tokens. This meant capital was flowing into the cryptocurrency.
This amount held represented about 0.86% of the total supply of HBAR, which was at 50 billion. That way, the demand stayed high, with Grayscale, REX-Osprey, and other institutions preparing to enter this race.
As demand increases, prices of HBAR are expected to follow suit, but when was this? The market cycles had the best answer. Currently, crypto is overly bearish.
Altogether, the HBAR price was showing multiple bullish signals despite the markets being very bearish. Even though ETFs were pumping capital, the markets were likely to extend this weakness, and HBAR was no exception.