
 no crying in the casino
 Pyth Network
 NEAR Protocol
 Starknet
 Quantus
 Pearl
Pearl Bitcoin

Zcash price is under immense downside pressure following a trend of long liquidations that hit the market. Volatility has been on the escalator as major support zones break. Analysts now warn that deeper retracements are possible should price fail to reclaim crucial levels.
Zcash Price Tests Support After Sharp Liquidations
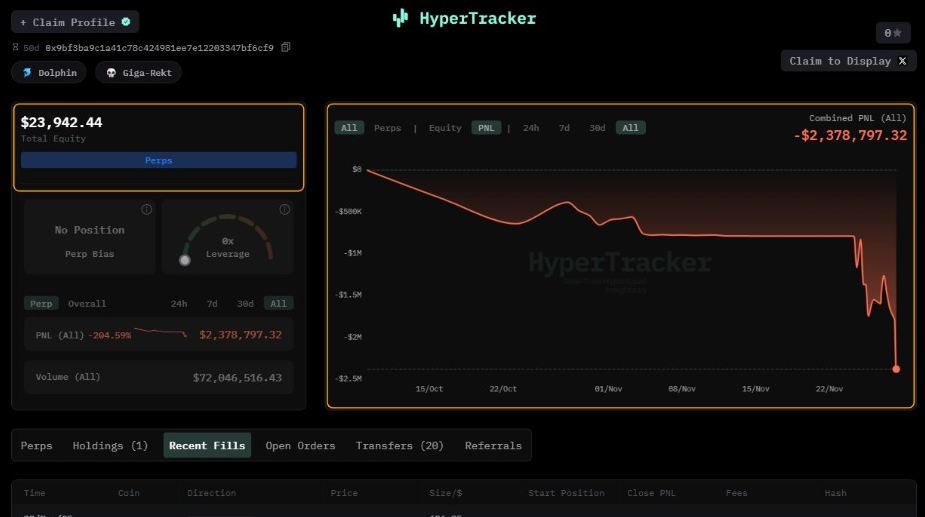
ZEC price is reacting to a severe series of liquidations on Onchain Lens. One whale lost $1.59 million after the long position was completely wiped out. The same trader lost $2.39 million with several positions, and he has just $24,000 in equity remaining.
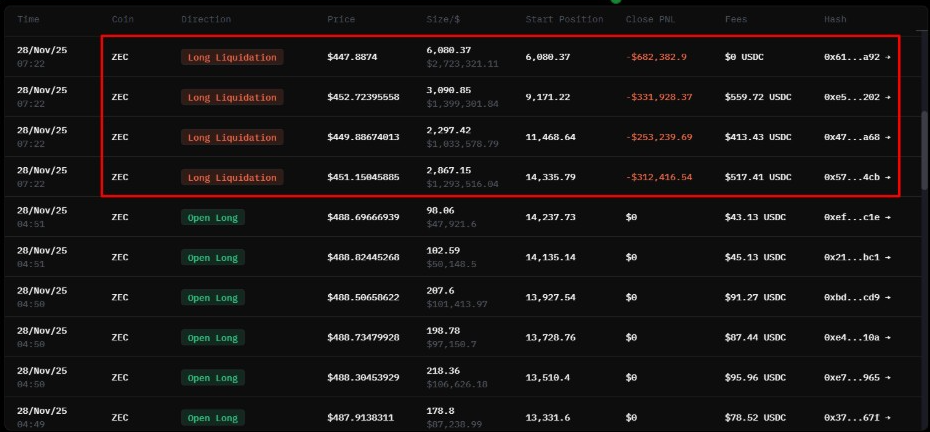
HyperTracker data showed the account’s cumulative P&L downwards over the course of 204% across recent trades.
The liquidation cluster was between $447 and $452, which confirms aggressive selling pressure. The final leg of losses took the price under several short-term support areas.
Market data according to CoinMarketCap showed Zcash price trading near $475 after a 9% drop in a day. Volume decreased nearly 20% which indicated forced selling and defensive positioning. Traders now watch to see if the price can stabilize after the rapid decline.
Major Breakdown Levels Influence Market Structure
The broader structure revealed a definite loss of some key levels. Analyst Altcoin Sherpa said the ZEC price is likely to fall to below $200 in the coming weeks. His chart has lower highs forming since the November peak, confirming weakening trend strength.
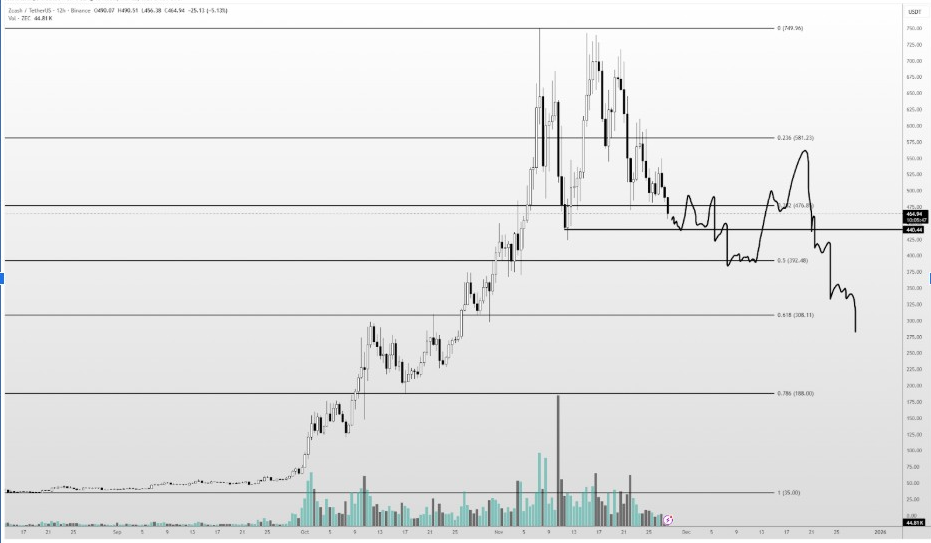
Sherpa marked $392, $308, and $188 as Fibonacci levels, which may act as downside magnets. He expects bounces during the market drop, but they may not turn the tide on the big picture. The chart showed sustained downtrend movement on the higher time frame.
The same weakness is observed in spot data. Zcash price rejected $518 earlier in the day and has since consolidated lower. Market depth reveals thinning support. This indicates the path of least resistance is still down until strong buyers return.
Support Zones and Breaks in Trends Signal Risk for Zcash Price
Ardi monitors technical breakdowns following important support. He pointed out that the ZEC price broke the 50-day SMA and the $480 support during the last few hours. Zcash price is now sitting on the 38.2% retracement level, a zone that saved the uptrend earlier this month.
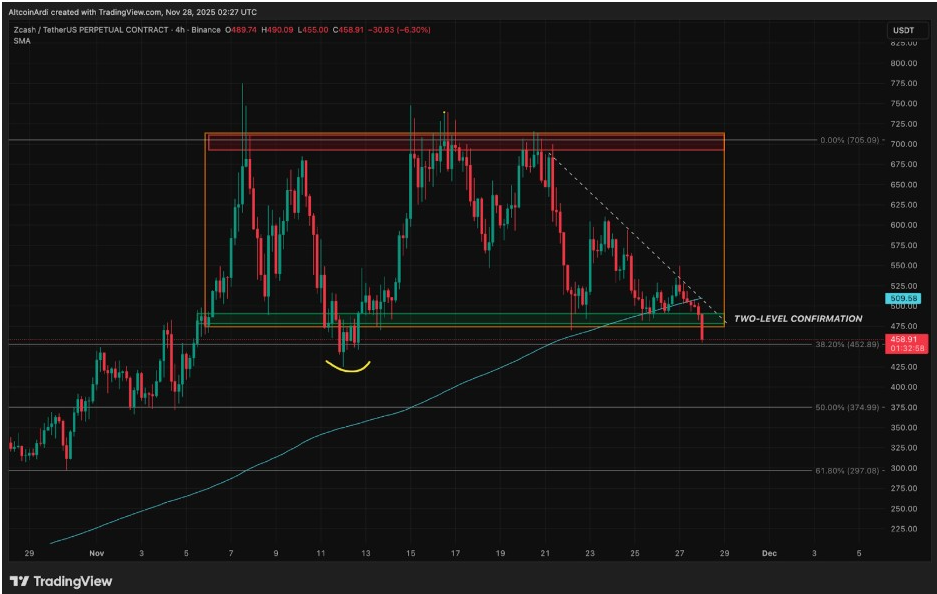
Ardi warned that multiple closes below the 38.2% level confirm a deeper structural break. He sees liquidity targets of between $410 and $425, with another zone between $370 and $380. These areas overlap previous levels of accumulation.
The chart also showed a “two-level confirmation” at $480. The down-sloping trendline and former support are now resistance. Reclaiming this zone would represent the breakdown as a liquidity sweep and not a complete trend reversal.
Long-Term Trendline Tests and Next Targets Defined
Analyst Brian2Jene offered the bigger picture of the trends. He said that the long-term trendline remains intact for now, but the ZEC price is approaching its lower boundary. The chart depicted a pattern of a rising wedge with tightening compression.
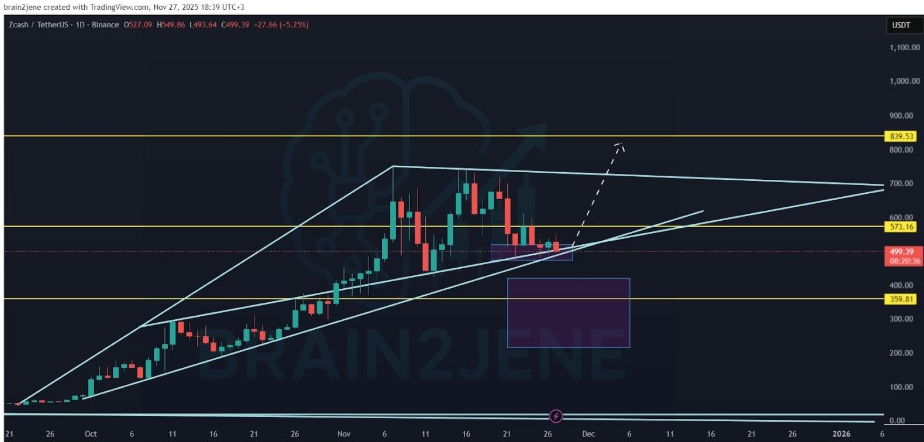
Brain2Jene asserts that the recovery of $575 is imperative before any meaningful recovery. Holding the trendline would put $839 as the next major upside target. His view shows that heavy moves may follow once ZEC eases out of the long-term triangle.
If a breakdown occurs, he expects a revisit to the $360 region. That zone correlates with historical support and high volume accumulation. Brain2Jene adds that the major uptrend does not resume until a clean break of the upper boundary of the wedge.


