
 astronaut
 Pearl
Pearl Zcash
Zcash Walrus
 NEAR Protocol
 Starknet
 Pudgy Penguins

XRP price has trended sharply lower in recent months. Its price fell from the July high of $3.6680 to $2.1866. This crash could be about to end as the token formed a highly bullish falling wedge and inverted head-and-shoulders pattern on the daily chart, and as XRP ETF inflows accelerate.
XRP Price Has Formed a Falling Wedge and an Inverse Head-and-Shoulders Pattern
The daily timeframe chart shows that the XRP price has remained under pressure in the past few months. It’s a move that has coincided with the ongoing crypto market crash that has affected most tokens.
The token began its downtrend after reaching the all‑time high of $3.6680 in July. It later plunged to $1.7710 on October 10. The crash coincided with crypto market liquidations soaring above $20 billion.
Ripple price remains under pressure despite the recent rebound. It is stuck below most moving averages and popular indicators like the Supertrend and the Ichimoku cloud.
Still, the XRP price has formed some notable bullish catalysts despite the ongoing bearishness. A closer look shows that it has formed a falling wedge pattern whose two lines are nearing their meeting point.
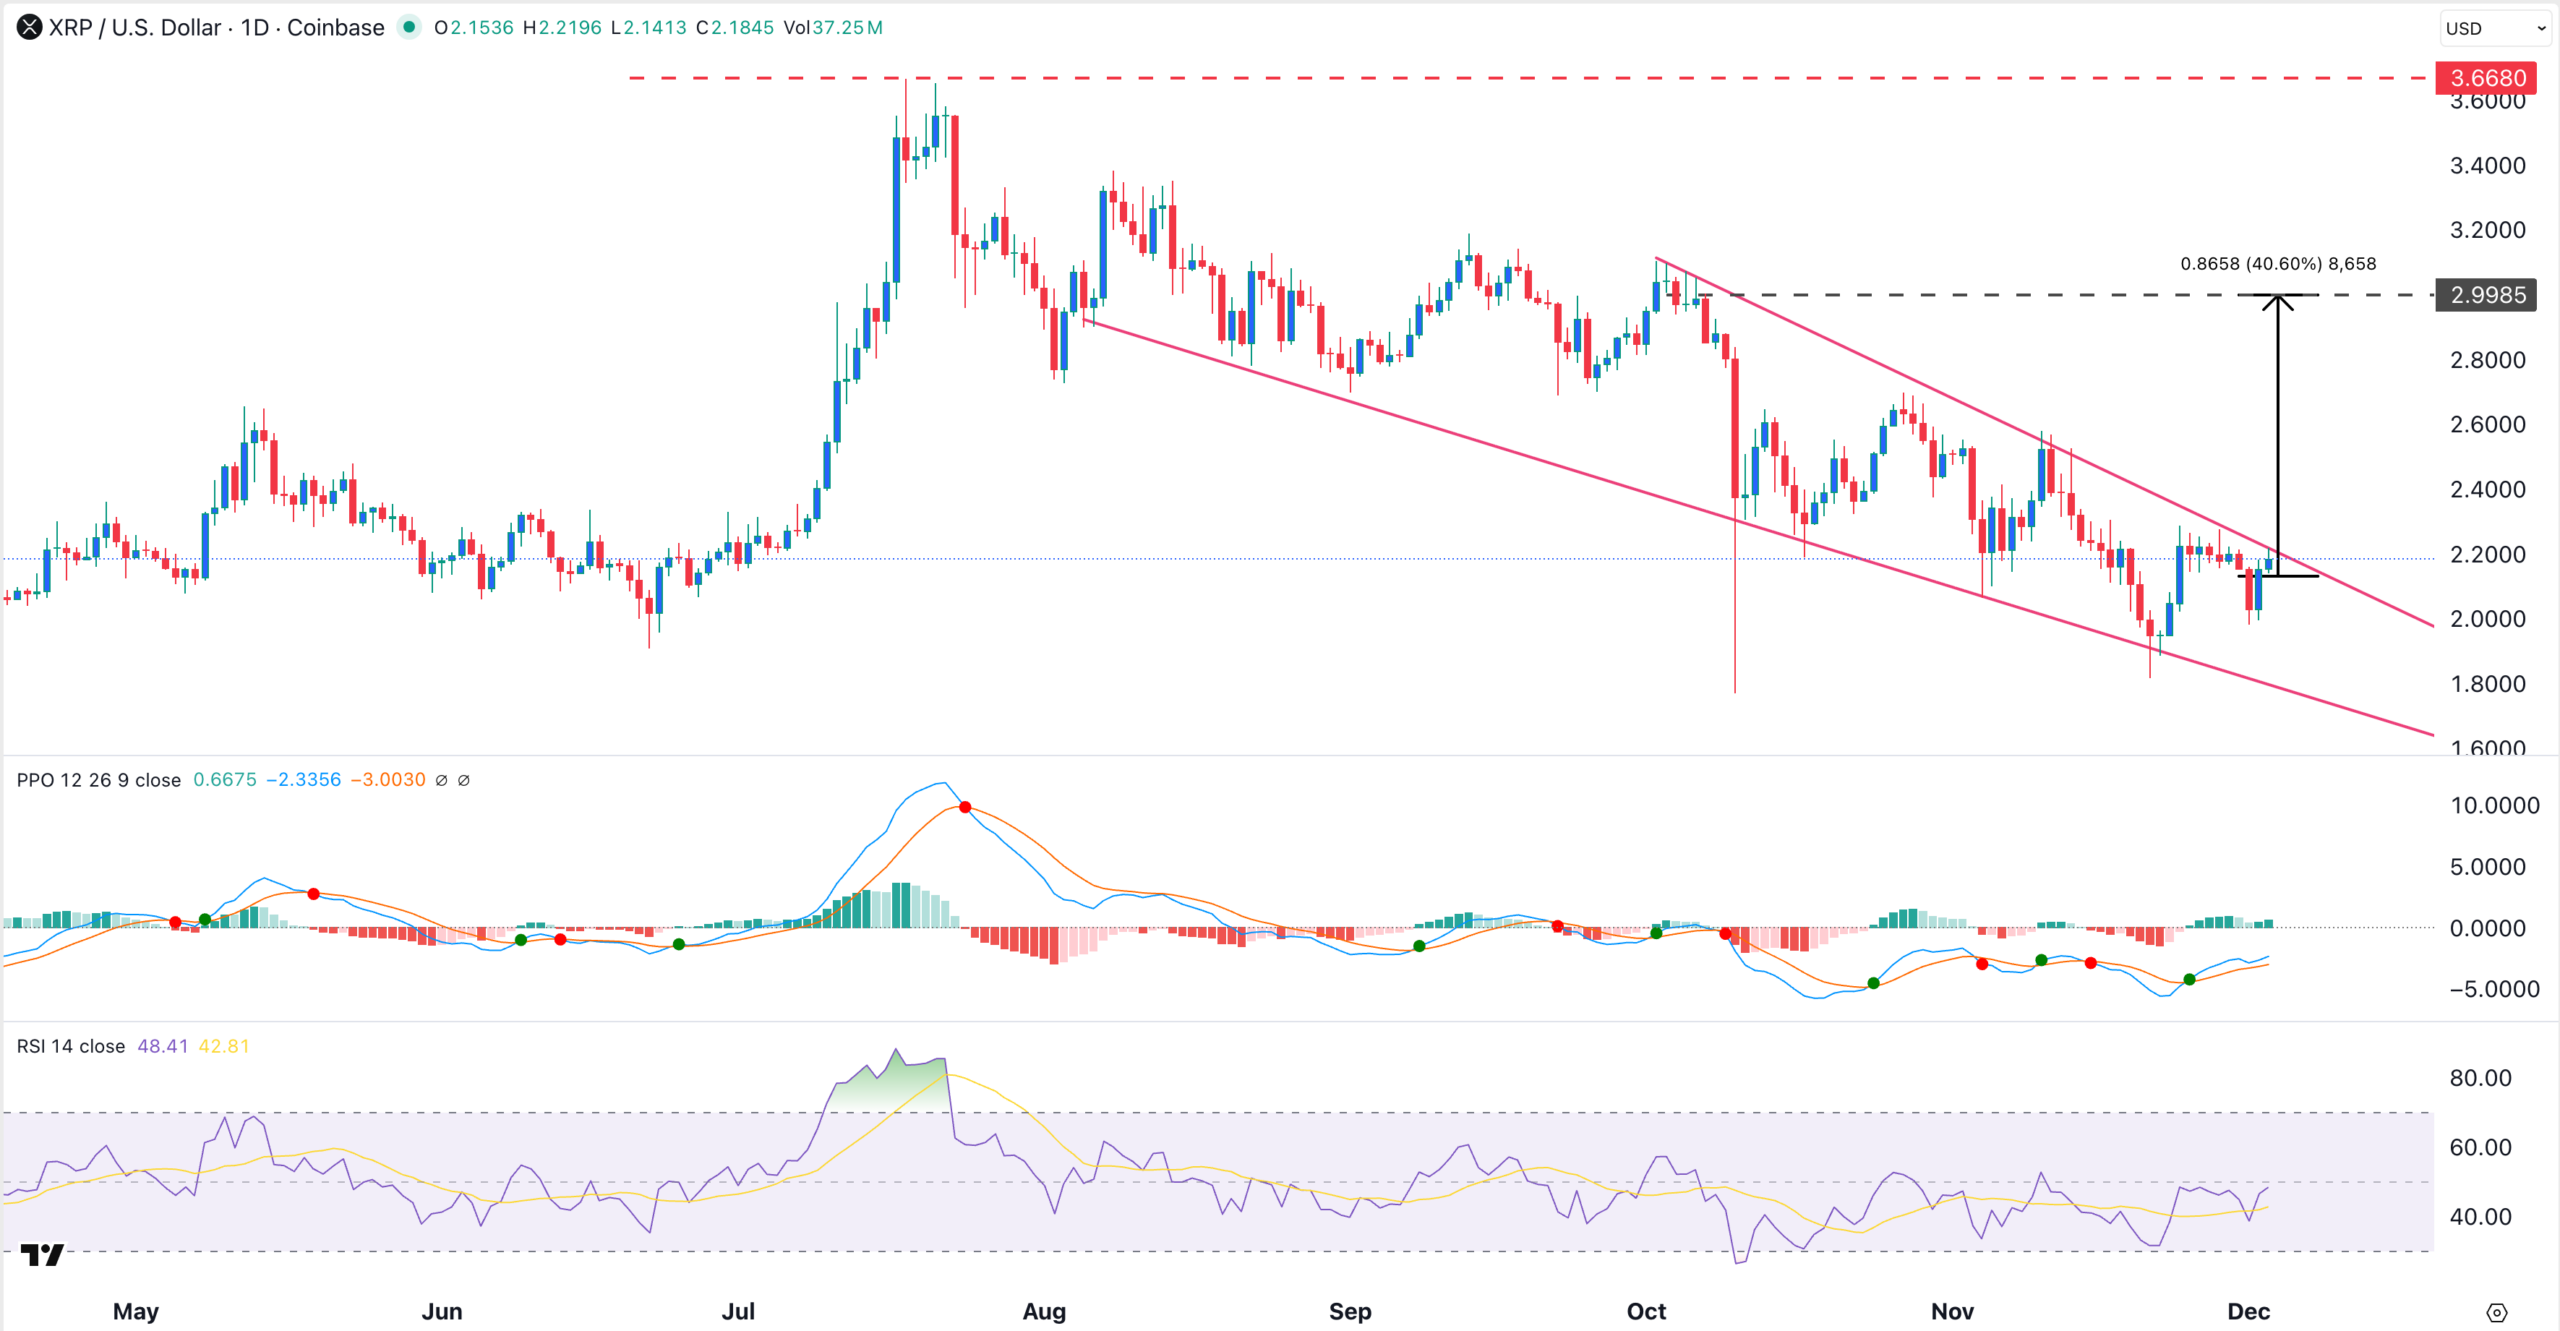
At the same time, it has slowly formed a small inverted head-and-shoulders pattern. Its neckline has coincided with the upper side of the falling wedge.
Additionally, the Percentage Price Oscillator (PPO) has formed a bullish divergence pattern. At the same time, the RSI is moving sideways and is below the neutral point at 50.
Therefore, a contrarian case can be made on the XRP price. A move above the upper side of the wedge will confirm the bullish outlook. This would also indicate further gains, potentially to the psychological level of $3. That’s approximately 40% above the current level.
The bullish Ripple price forecast will become invalid if it drops below $1.8242. It’s the head section of the inverted H&S pattern.
XRP ETF Inflows are a Major Catalyst
Resilient demand from American investors has emerged as a key catalyst for the XRP price. This steady interest is helping support the token despite broader market pressures.
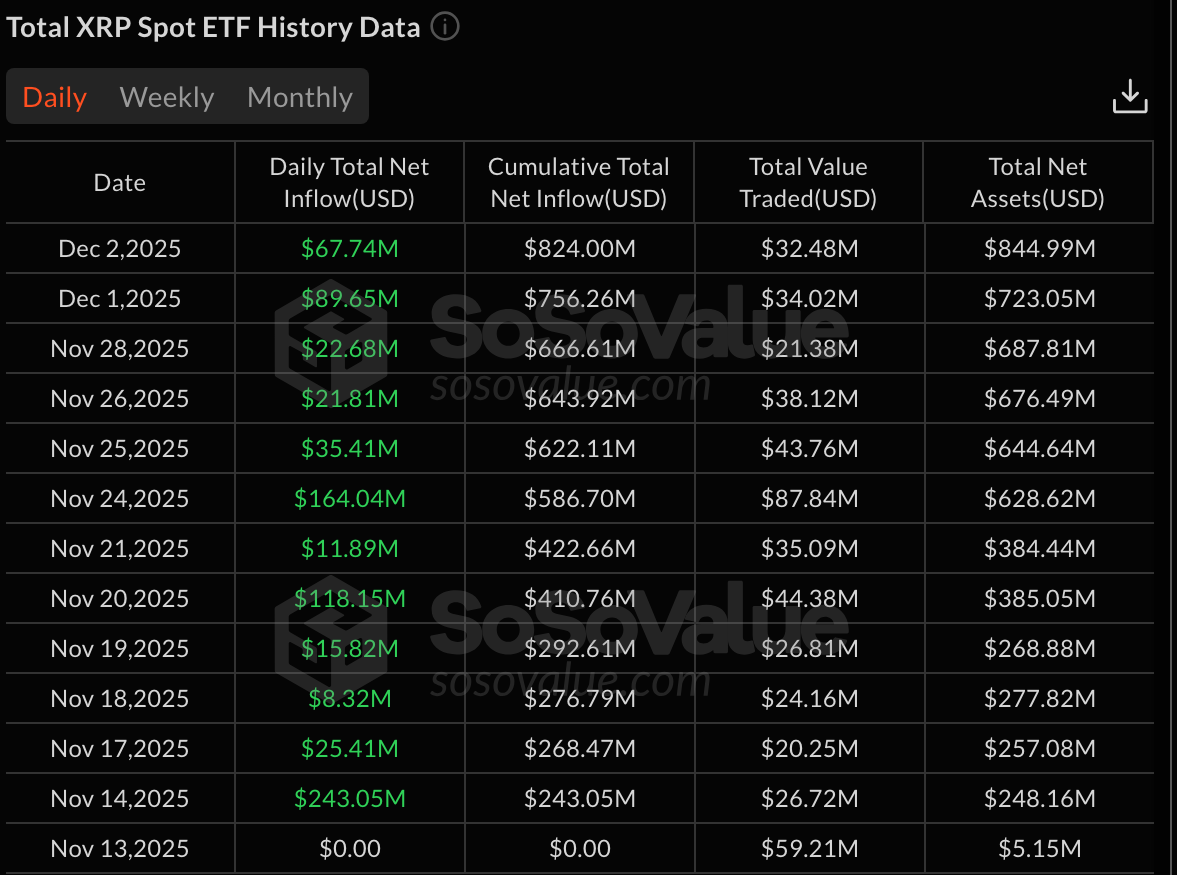
Data shows that the four XRP ETFs have never had a day of outflows since their approval last month. They continued to experience inflows even on Monday when the painful crypto market plunge happened.
The numbers show that the XRP ETFs added $67 million in inflows on Tuesday. That’s higher than what Bitcoin and Ethereum brought in. Their weekly ETF inflows stand at $157 million, higher than Ethereum’s outflows of $89 million and Bitcoin’s inflow of $66 million.
Most importantly, analysts believe that XRP ETFs have a long way to go in terms of inflows. It’s a move that will lead to more demand over time. For example, analysts at JPMorgan predicted that Ripple ETFs will have about $8 billion in inflows in the first year.
XRP ETFs now hold $844 million in assets, which is equivalent to 0.65% of the market capitalization. If they match Bitcoin’s 6%, it means that demand will keep soaring.
Ripple USD (RLUSD) Growth is Continuing
Another key catalyst for the XRP price in the near term is its expanding role in payments. The token’s growing adoption in the industry is accelerating momentum.
One way it is achieving this is by using Ripple USD (RLUSD), the stablecoin it launched in December last year. This stablecoin has continued gaining momentum, with its total supply soaring by 23% in the last 30 days to $1.3 billion.
Additionally, the number of transactions in the same period rose by 12% to 441,000. On the other hand, the adjusted transaction volume soared to $3 billion. That is a sign that it is being used to settle transactions.
In summary, XRP price has formed several bullish patterns on the daily chart. Also, it has some notable fundamentals that may help to drive its recovery in the near term.




