
 Pearl
Pearl Zylo Ecosystem
 Bitway
 Derive
 Walrus
 Quantus
 Pudgy Penguins

Bitcoin price prediction is entering a decisive phase as multiple technical, institutional, and macro indicators begin to align. Recent chart analyses suggested that BTC is compressing within a structure that historically precedes large directional moves.
At the same time, renewed signals from long-term corporate holders and changing macro relationships with traditional assets are adding context to the next potential breakout.
Bitcoin Price Prediction: Ascending Structure Signals Breakout
Analyst Elja’s chart focused on a classic ascending triangle formation developing after a sharp decline in Bitcoin price and subsequent stabilization. The structure showed rising lows supported by an upward-sloping trendline, while BTC price repeatedly tests a flat resistance zone.
This pattern reflects increasing buyer aggression. That’s because each pullback resolves at higher levels despite sellers defending the same overhead range.
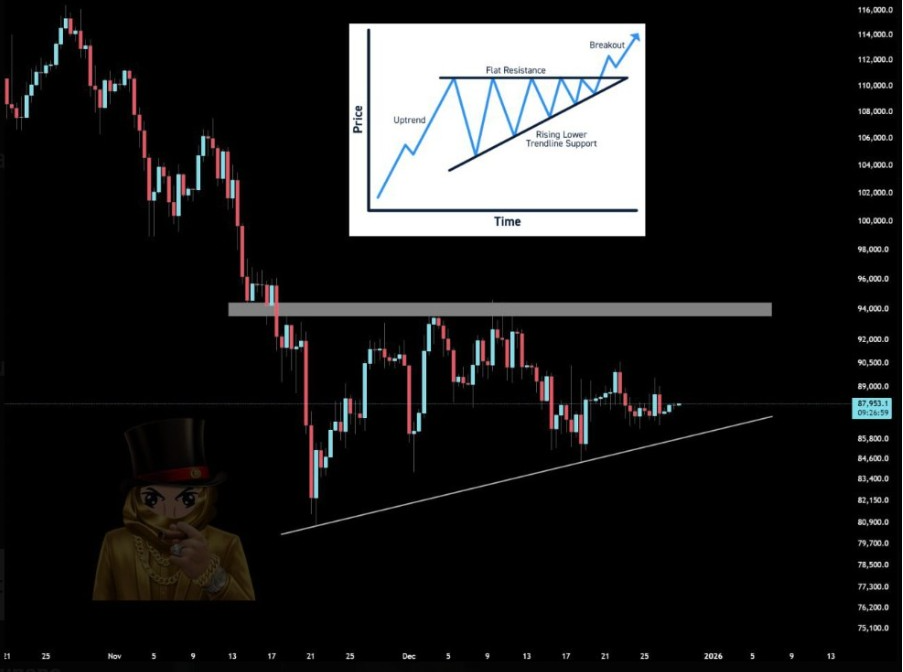
Historically, such compression often resolves with a volatility expansion once price decisively clears resistance. The longer Bitcoin coils within this structure, the more energy builds for a directional move. Moreover, this formation developed over several weeks, which increases its technical relevance.
Institutional Accumulation Reinforces the Bullish Case
Another analyst highlighted renewed signals from Michael Saylor, whose firm has consistently accumulated Bitcoin across multiple market cycles. Portfolio data shows that these purchases clustered during periods of price weakness or consolidation, rather than near cycle tops.
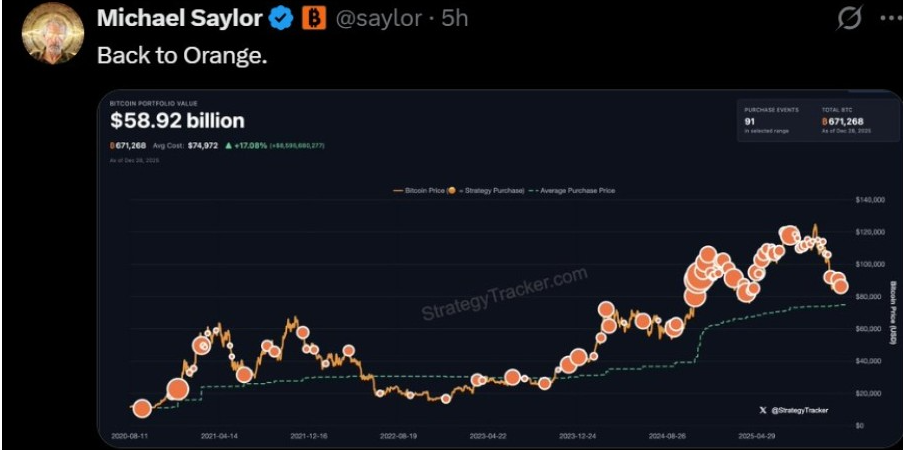
From a Bitcoin price prediction standpoint, this trend matters. It reflects long-duration capital with little sensitivity to short-term volatility. Large, price-insensitive buyers reduce available supply during consolidation phases, which amplifies upside moves.
Moreover, Saylor’s accumulation strategy preceded institutional participation. This move adds a supportive backdrop to the technical structure forming on the charts.
Bitcoin and Gold: A Cyclical Rotation Framework
The macro overlay comparing Bitcoin to Gold introduced a longer-term perspective. The analysis argued that Bitcoin lagged Gold during periods when central banks prioritized physical reserves over digital assets. This divergence widened as Gold attracted defensive flows, while Bitcoin consolidated.
However, the framework also notes that previous cycles often follow a similar sequence. Gold tends to peak first, capital rotation follows, and Bitcoin then absorbs speculative and growth-oriented flows.
Meanwhile, Bitcoin/Gold RSI is testing a long-running purple downtrend line on the chart. This setup appeared four times before, in 2011, 2015, 2018, and 2022.
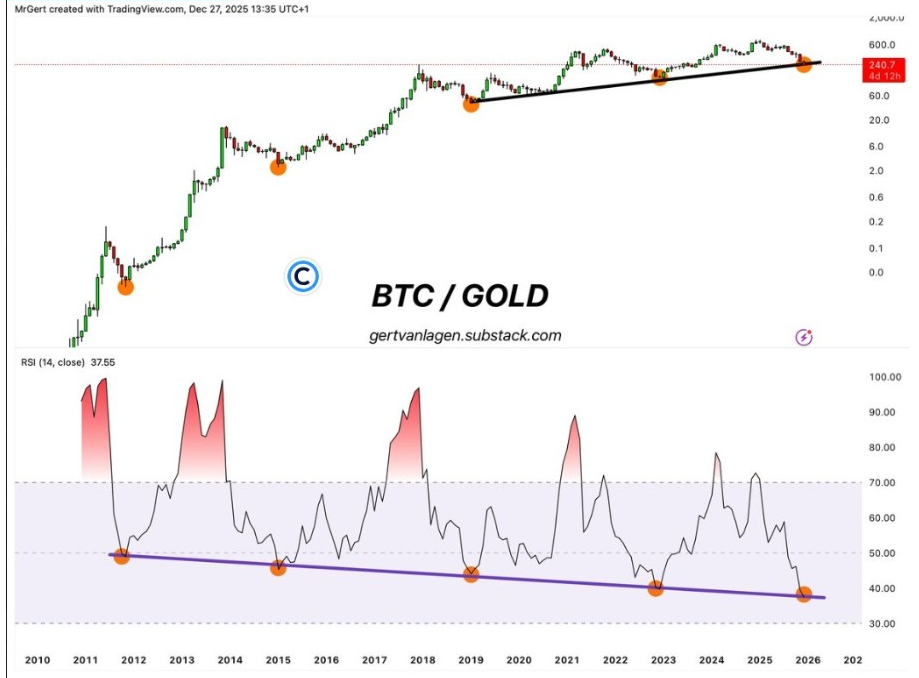
In each case, the touch coincided with a cycle low and a higher low in BTC/GOLD. The pair is currently testing the 2025 level, keeping reversal risk on traders’ radar.
Hidden Bullish Divergence Supports Trend Continuation
Trader Tardigrade’s weekly RSI analysis adds a momentum-based confirmation to the broader picture. The chart identifies a hidden bullish divergence, where price forms higher lows while RSI prints lower lows.
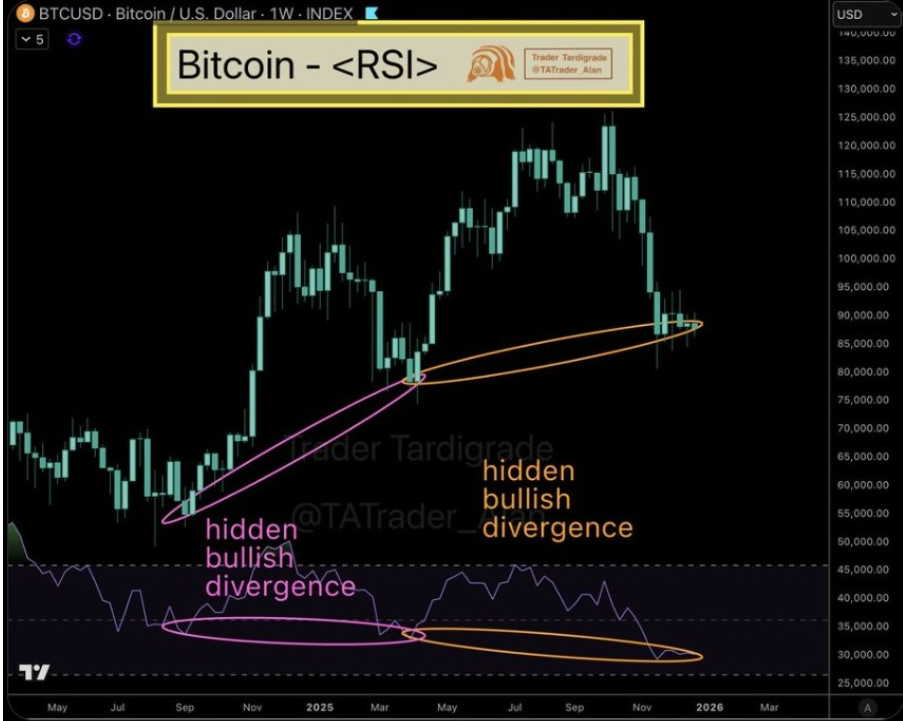
A hidden bullish divergence suggests that downside momentum is weakening, even as the price consolidates.
In past Bitcoin cycles, similar signals have appeared near the end of corrective ranges before trend continuation resumes. Because this signal is visible on the weekly timeframe, it carries more weight than short-term momentum oscillations.
This divergence aligns with the ascending triangle structure, reinforcing the idea that Bitcoin’s current range may represent consolidation. Therefore, Bitcoin price remains in a technically constructive phase for now.



