
 Pearl
Pearl Bitway
 NEAR Protocol
 Sui
Sui Pudgy Penguins
 Starknet
 Pons
Pons

Gold price hovered around the $4,500 area on Dec. 24 as XAU/USD extended its 2025 uptrend on several widely shared charts. Technical analysis indicated a breakout from an ascending triangle, suggesting that the market is now testing whether it can hold above its former resistance.
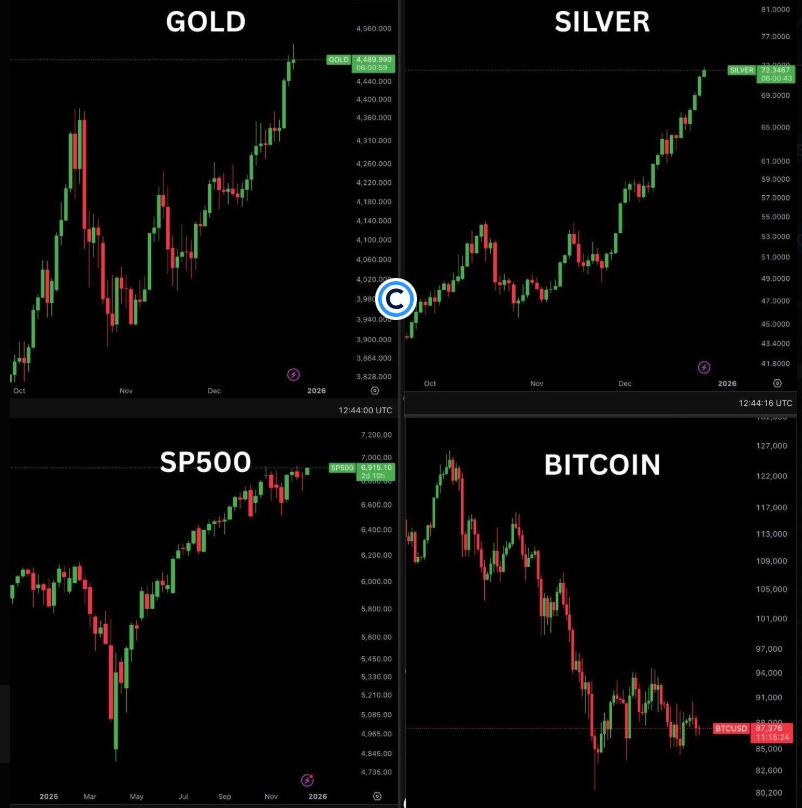
The separate market trend showed strength across several asset classes. One multi-chart image placed gold near $4,489.99, silver near $72.3467, and the S&P 500 around $6,916.10, while Bitcoin traded near $87,300.
Ascending Triangle Breakout Keeps Gold Price Near Highs
Analyst EGRAG CRYPTO noted Gold price is breaking out of an ascending triangle, a continuation pattern that traders often watch during persistent trends. The chart shared showed price pushing through a prior ceiling and printing new highs into late December.
GoldPredictors also said Gold continues to follow its breakout path and expected price to continue higher based on the structure shown. Its chart marked prior stair-step advances where short consolidations followed breakouts before another upward leg.
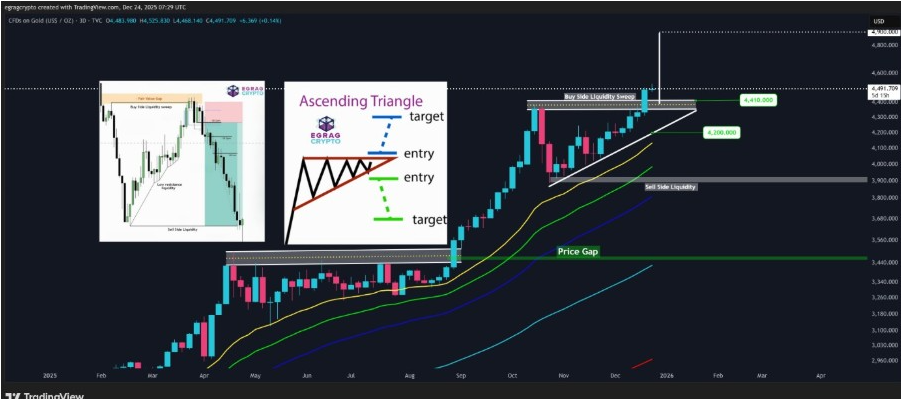
EGRAG CRYPTO flagged the $4,200 zone as the area that keeps the breakout valid on its macro view. The post stated that holding above that level supports the current structure, while a move back below the breakout area would be an early warning that the trend is losing momentum.
The same analysis indicated that acceptance above the $4,400 to $4,500 band was the condition that could keep the advance active. On TradingView, Gold price action consolidated near the upper boundary after a buy-side liquidity sweep was marked near the highs.
Other reference areas were also labeled on the chart for traders tracking pullbacks. Those included $4,410 as a nearer downside checkpoint, a sell-side liquidity zone around $3,900, and a lower “price gap” area near $3,440.
Il Capo Of Crypto said Gold price has reached a long-tracked $4,500 target and noted that short-term pullbacks can follow steep moves. The account added that it remains positioned in Gold and Silver for the longer term, while acknowledging near-term volatility.
Silver and Equities Rise as Bitcoin Remains Below its Peak
Meanwhile, a four-panel chart showed silver also trending higher into late December, with the label near $72.3467. The same image showed the S&P 500 pressing near $6,916.10 after a recovery from a sharp drawdown earlier in the year.
Bitcoin, by contrast, was shown trading near $87,376 and sitting well below the prior high on that chart window. A separate post compared Bitcoin’s pullback to gains in metals and equities.
Meanwhile, another analyst noted that Gold often leads major risk-on rotations before Bitcoin accelerates with stronger momentum. The chart shows gold rallies forming earlier peaks, followed by sharper Bitcoin advances as capital reallocates.
This pattern suggests investors first seek safety, then rotate into higher-beta assets. As liquidity conditions loosen, Bitcoin tends to outperform Gold in the later phase of the move.
Macro Drivers Include Rates, Geopolitics, and Central Bank Demand
A BBC business report published earlier this week said Gold moved above $4,400 an ounce and later extended gains as investors positioned for more U.S. interest-rate cuts next year. It cited analysts who said lower rate expectations can reduce bond returns and keep attention on assets such as Gold and other commodities.
The same report tied 2025 demand to geopolitical tensions and trade uncertainty. BullionVault research director Adrian Ash said the year’s price rise reflected a mix of rate trends and global risks.
It also stated that central banks have continued to build physical gold holdings to diversify their reserves, referencing Goldman Sachs’ research, which expects this trend to continue in 2026. Additionally, it noted that a weaker U.S. dollar can make gold more affordable for overseas buyers.
Analysts now focus on whether Gold price can remain above the breakout zone while testing the $4,500 area. Traders also watch for consolidation above prior highs and a clean retest of the support level.
For near-term positioning, the levels most often repeated are $4,500 and $4,400 on the topside, with $4,200 as the key support that keeps the breakout case intact.




