
 Pearl
Pearl Zylo Ecosystem
 Bitway
 Derive
 Walrus
 Quantus
 Pudgy Penguins

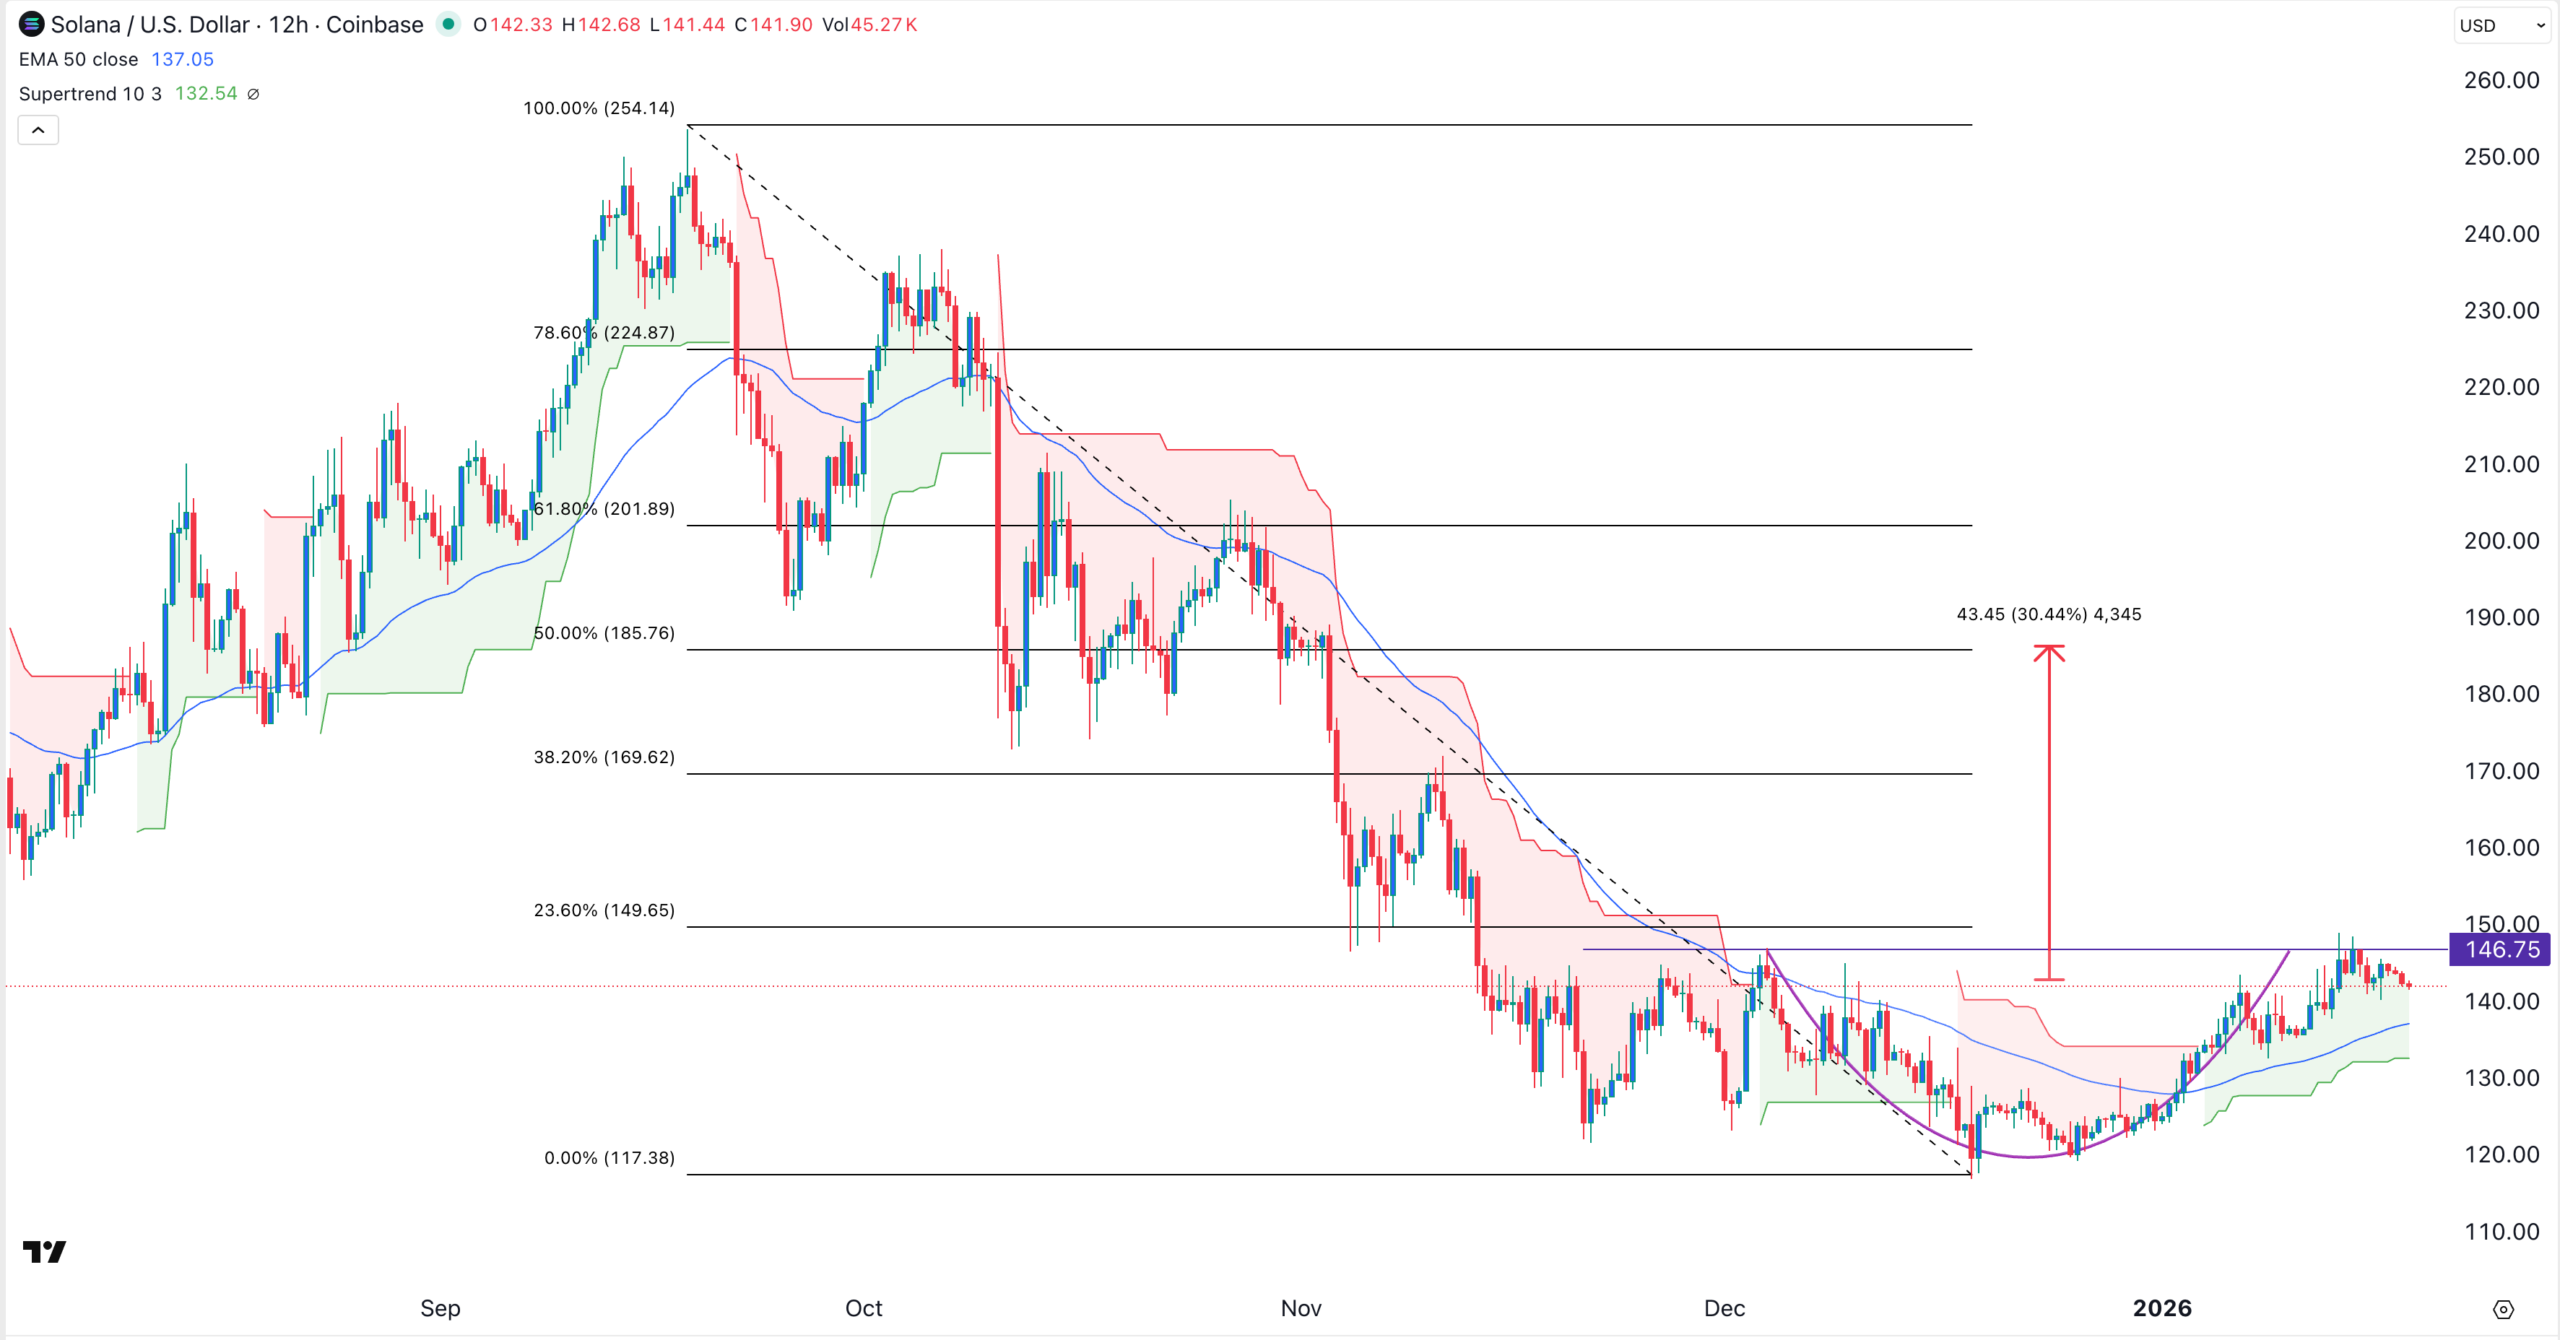
Solana price has pulled back in the past few days, moving from a high of $148 on January 13 to the current $142. Still, this retreat could be the calm before the storm as it has formed the highly bullish cup-and-handle pattern as its key metrics like active addresses and decentralized exchange (DEX) volume surges.
Solana Price Technical Analysis as Cup and Handle Pattern Forms
The 12-hour chart shows that Solana price bounced back from the year-to-date low of $117 on December 18 to a high of $148. This rally then paused last week after the CLARITY Act stalled in the Senate Banking Committee before the markup.
However, a closer look shows that the coin has formed a cup-and-handle pattern, characterized by a rounded bottom and a pullback when it retests the cup’s upper side. A cup-and-handle is one of the most popular bullish continuation patterns in technical analysis.
The cup’s upper side coincided with the 23.6% Fibonacci Retracement level. Also, the token has remained above the Supertrend indicator and the 50-period Exponential Moving Average (EMA).
Therefore, the most likely Solana price prediction is bullish, with the next key target level being at the 38.2% Fibonacci Retracement level at $170. A move above that price will signal further gains, potentially to the 50% retracement at $185.
On the other hand, a drop below the key support level at $130 will invalidate the bullish price forecast for Solana.
Solana Active Addresses and Feed are Soaring
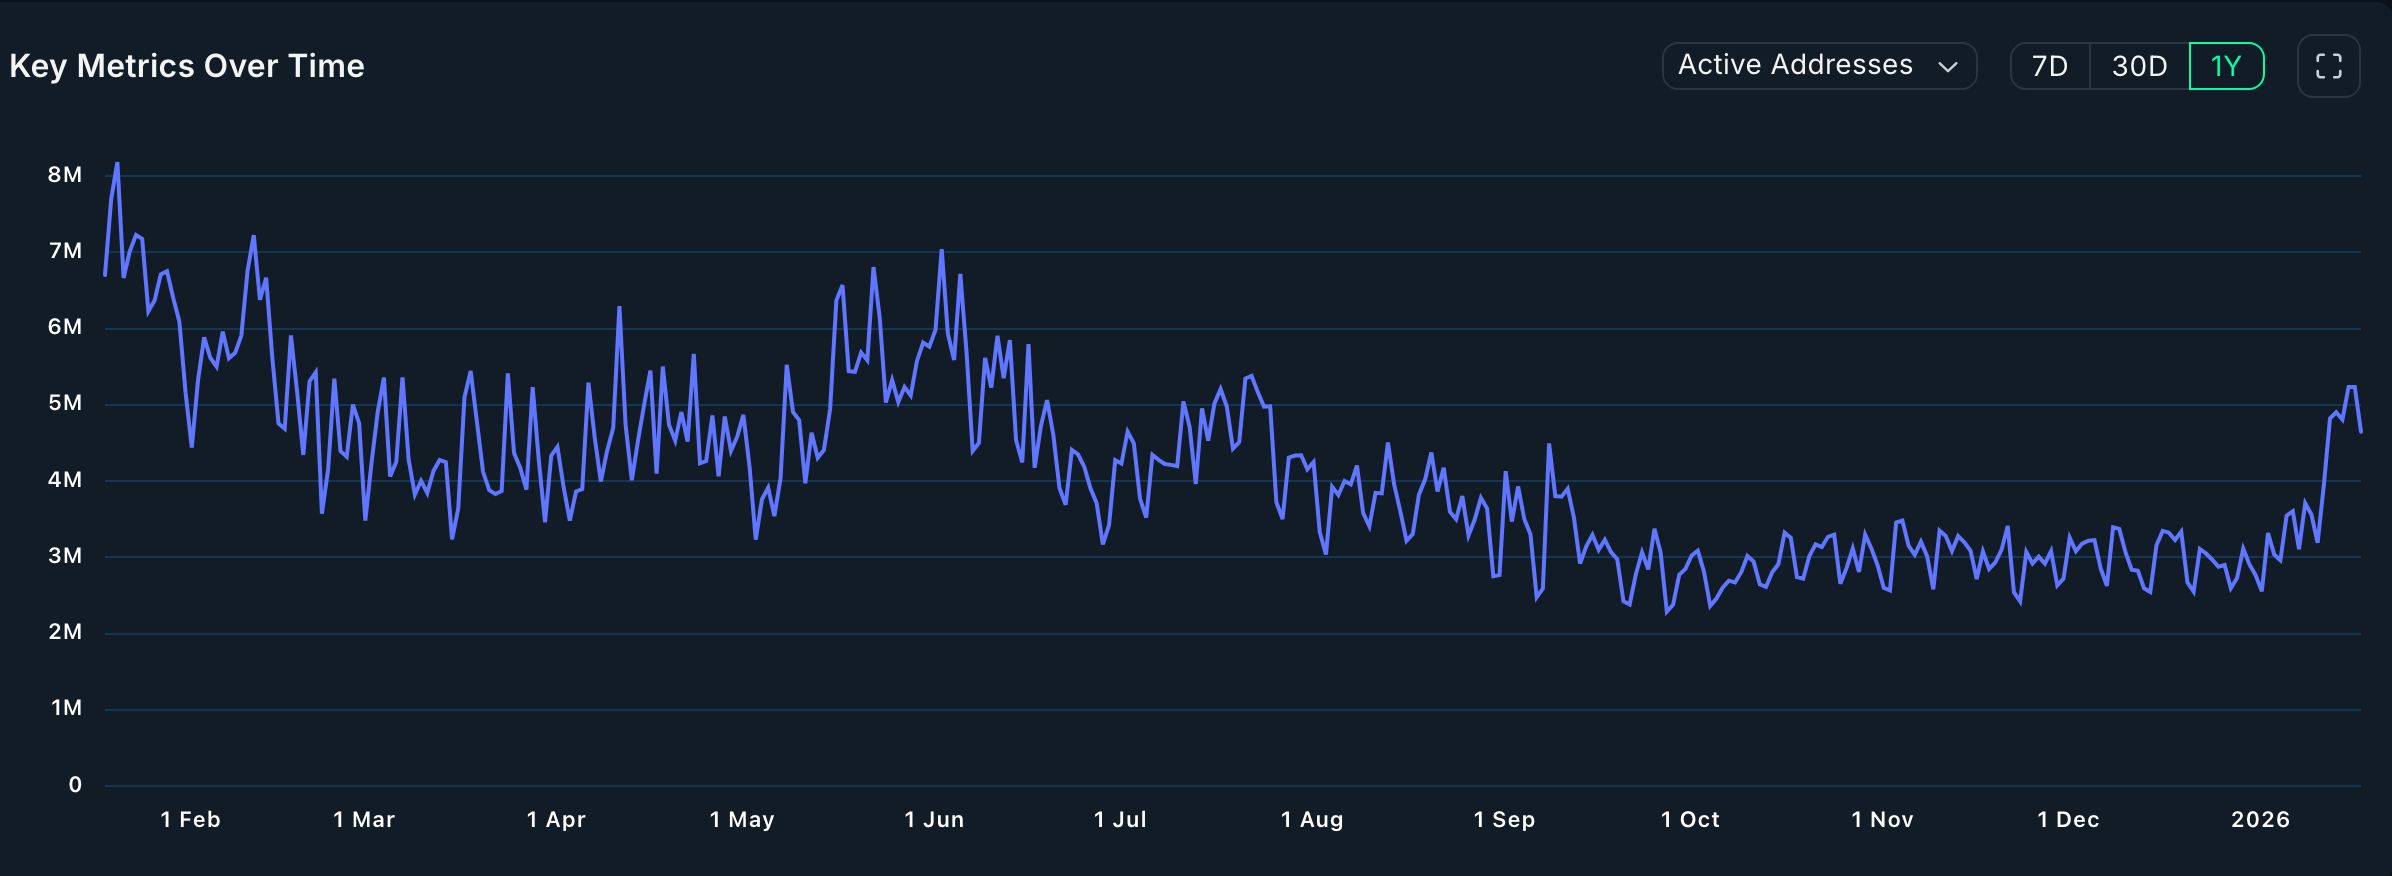
Meanwhile, Solana has some of the best fundamentals in the crypto industry. Data compiled by Nansen shows that the network growth has continued to accelerate in the past few months.
Solana active addresses rose by 18% in the last 30 days to over 70 million, making it the most active blockchain network in the crypto industry. Ethereum had 13.25 million active addresses, while Aptos, Polygon, and BNB Chain had 14 million, 11.7 million, and 42 million users, respectively, in the same period.
Solana’s transaction volume continued to rise, a sign that people are using and interacting with the network and its applications. Its active users rose by 1% in the last 30 days to over 1.8 billion, much higher than other networks, combined. Ethereum handled 59 million transactions, while BSC and Tron handled 420 million and 314 million transactions, combined.
All this growth has made it the second most-profitable chain in the crypto industry after Tron. Its network generated over $18 million in fees, a 24% monthly increase.
DEX Volume Surges Ahead of Alpenglow Upgrade
More data shows that Solana has become the most dominant player in the decentralized exchange (DEX) industry. Protocols in its ecosystem handled volume worth over $2.9 billion in the last 24 hours and $101 billion in the last 30 days.
In contrast, Ethereum’s protocols handled over $41 billion in volume in the last 30 days, while BSC processed transactions worth $43 billion in the same period. This means that it is handling more volume than Ethereum, BSC, and Base combined.
These metrics are likely to improve after the network launches the closely watched Alpenglow upgrade this quarter. The upgrade will introduce major network features, such as faster speeds and a complete redesign of its architecture.
More data shows that American investors are still buying SOL ETFs. The funds added $46 million in inflows last week, even after suffering a $2.2 million outflow. They have had net inflows of over $863 million and now hold $1.21 billion in assets.
Bitwise Solana ETF holds over $804 million in Solana ETFs and is followed by Grayscale’s GSOL, Fidelity’s FSOL, and VanEck’s VSOL.
To sum it up, Solana has some solid technicals, including the cup-and-handle pattern, and fundamentals, including rising ETF inflows and encouraging network metrics.



