
 Pearl
Pearl Walrus
 Starknet
 Quantus
 Bitway
 Sui
Sui Zylo Ecosystem

Solana price has retreated sharply after peaking at $148 on January 13. It has moved into a technical bear market, mirroring the performance of other altcoins.
However, the SOL price has formed a highly bullish inverted head-and-shoulders pattern. This pointed to a rebound as ETF inflows continue and network activity surges.
Solana Price to Benefit as SOL ETF Inflows Continue
Solana price has remained under pressure in the past few weeks despite having some of the best-performing fundamentals.
One of the top fundamentals is that spot SOL ETFs have continued adding assets even as other assets shed assets. Spot Solana ETFs added over $1.87 million in assets on Friday, bringing the weekly gains to over $9.58 million.
In contrast, spot XRP ETFs shed over $40 million in assets. At the same time, spot Solana funds had over $611 million in inflows during the week. Spot Bitcoin ETFs have suffered outflows in the last five consecutive days, bringing the cumulative outflows to over $1.3 billion.
Therefore, these numbers mean that demand for Solana ETFs has continued rising in the past few weeks. That’s a good thing. Solana ETFs have had over $873 million in cumulative inflows since their approval last year. This brought their total assets to over $1.08 billion.
The Bitwise Solana ETF continues to lead in terms of assets with over $712 million. ETFs of companies like Grayscale, Fidelity, and VanEck follow it. This growth will likely continue when the recently filed Morgan Stanley Solana ETF is approved.
The ongoing Solana ETF inflows have been accompanied by the surging staking inflows. Data from StakingRewards shows its Staking Ratio crossed 70%.
The staking market capitalization soared past $54 billion. In contrast, popular tokens like Ethereum and BNB have a smaller staking ratio.
Solana Network Growth is Accelerating
One potential reason why spot Solana ETFs are booming is that investors are seeing its strong network growth. That is largely unmatched in the crypto industry.
For example, Data from Nansen shows strong growth. Network transactions jumped past 2 billion. This surge happened in just 30 days. This transaction count is much higher than that of other chains combined.
For example, the Ethereum network handled over 64 million transactions. On the other hand, Near Protocol handled over 110 million. BNB Chain, Tron, Polygon, and Sui handled 438 million, 321 million, 173 million, and 118 million, respectively.
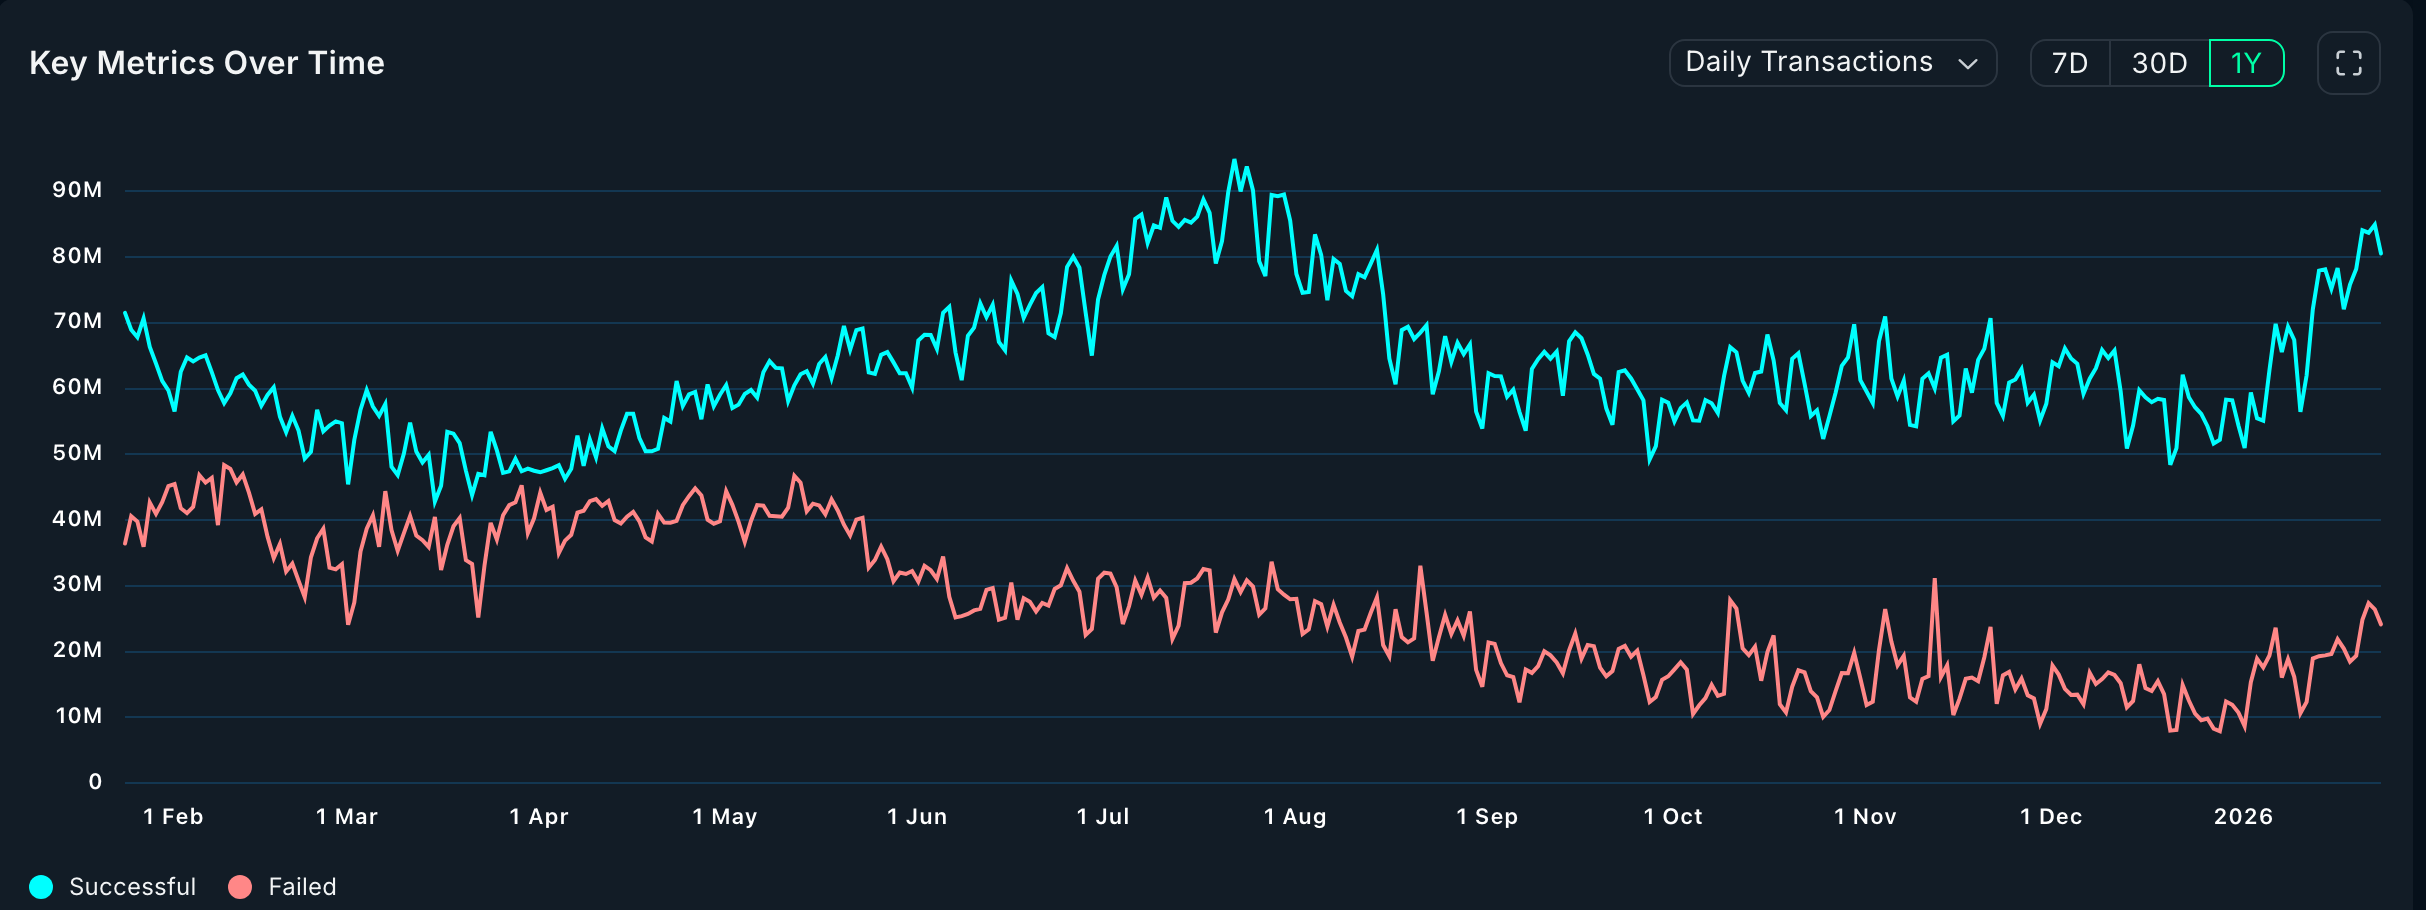
Solana’s active addresses have also continued rising. This happened despite the ongoing weakness among its meme coins like Official Trump and Bonk. It had over 81 million active addresses, much higher than Ethereum’s 14 million, BNB Chain’s 41 million, and Tron’s 17 million.
Solana is expanding its popularity beyond the meme coin industry. For example, it has become a major player in the real-world asset (RWA) tokenization industry. The value of tokenized stocks in the network has jumped to over $1.6 billion.
All this has led to a surge in network fees, which moved to over $20 million in the last 30 days.
Solana Price Technical Analysis
The 12-hour chart shows Solana price pulled back. This decline continued for several days. The ongoing crypto market crash accelerated the drop.
On the positive side, the coin has slowly formed an inverted head-and-shoulders pattern. It’s a common bullish reversal sign. This pattern’s neckline is at $145, while the shoulders are at $124.
Therefore, the most likely Solana price prediction is bullish, with the initial target being at $145. Moving above that level will point to more gains, potentially to the 50% Fibonacci Retracement level at $185. That is 45% above the current level.
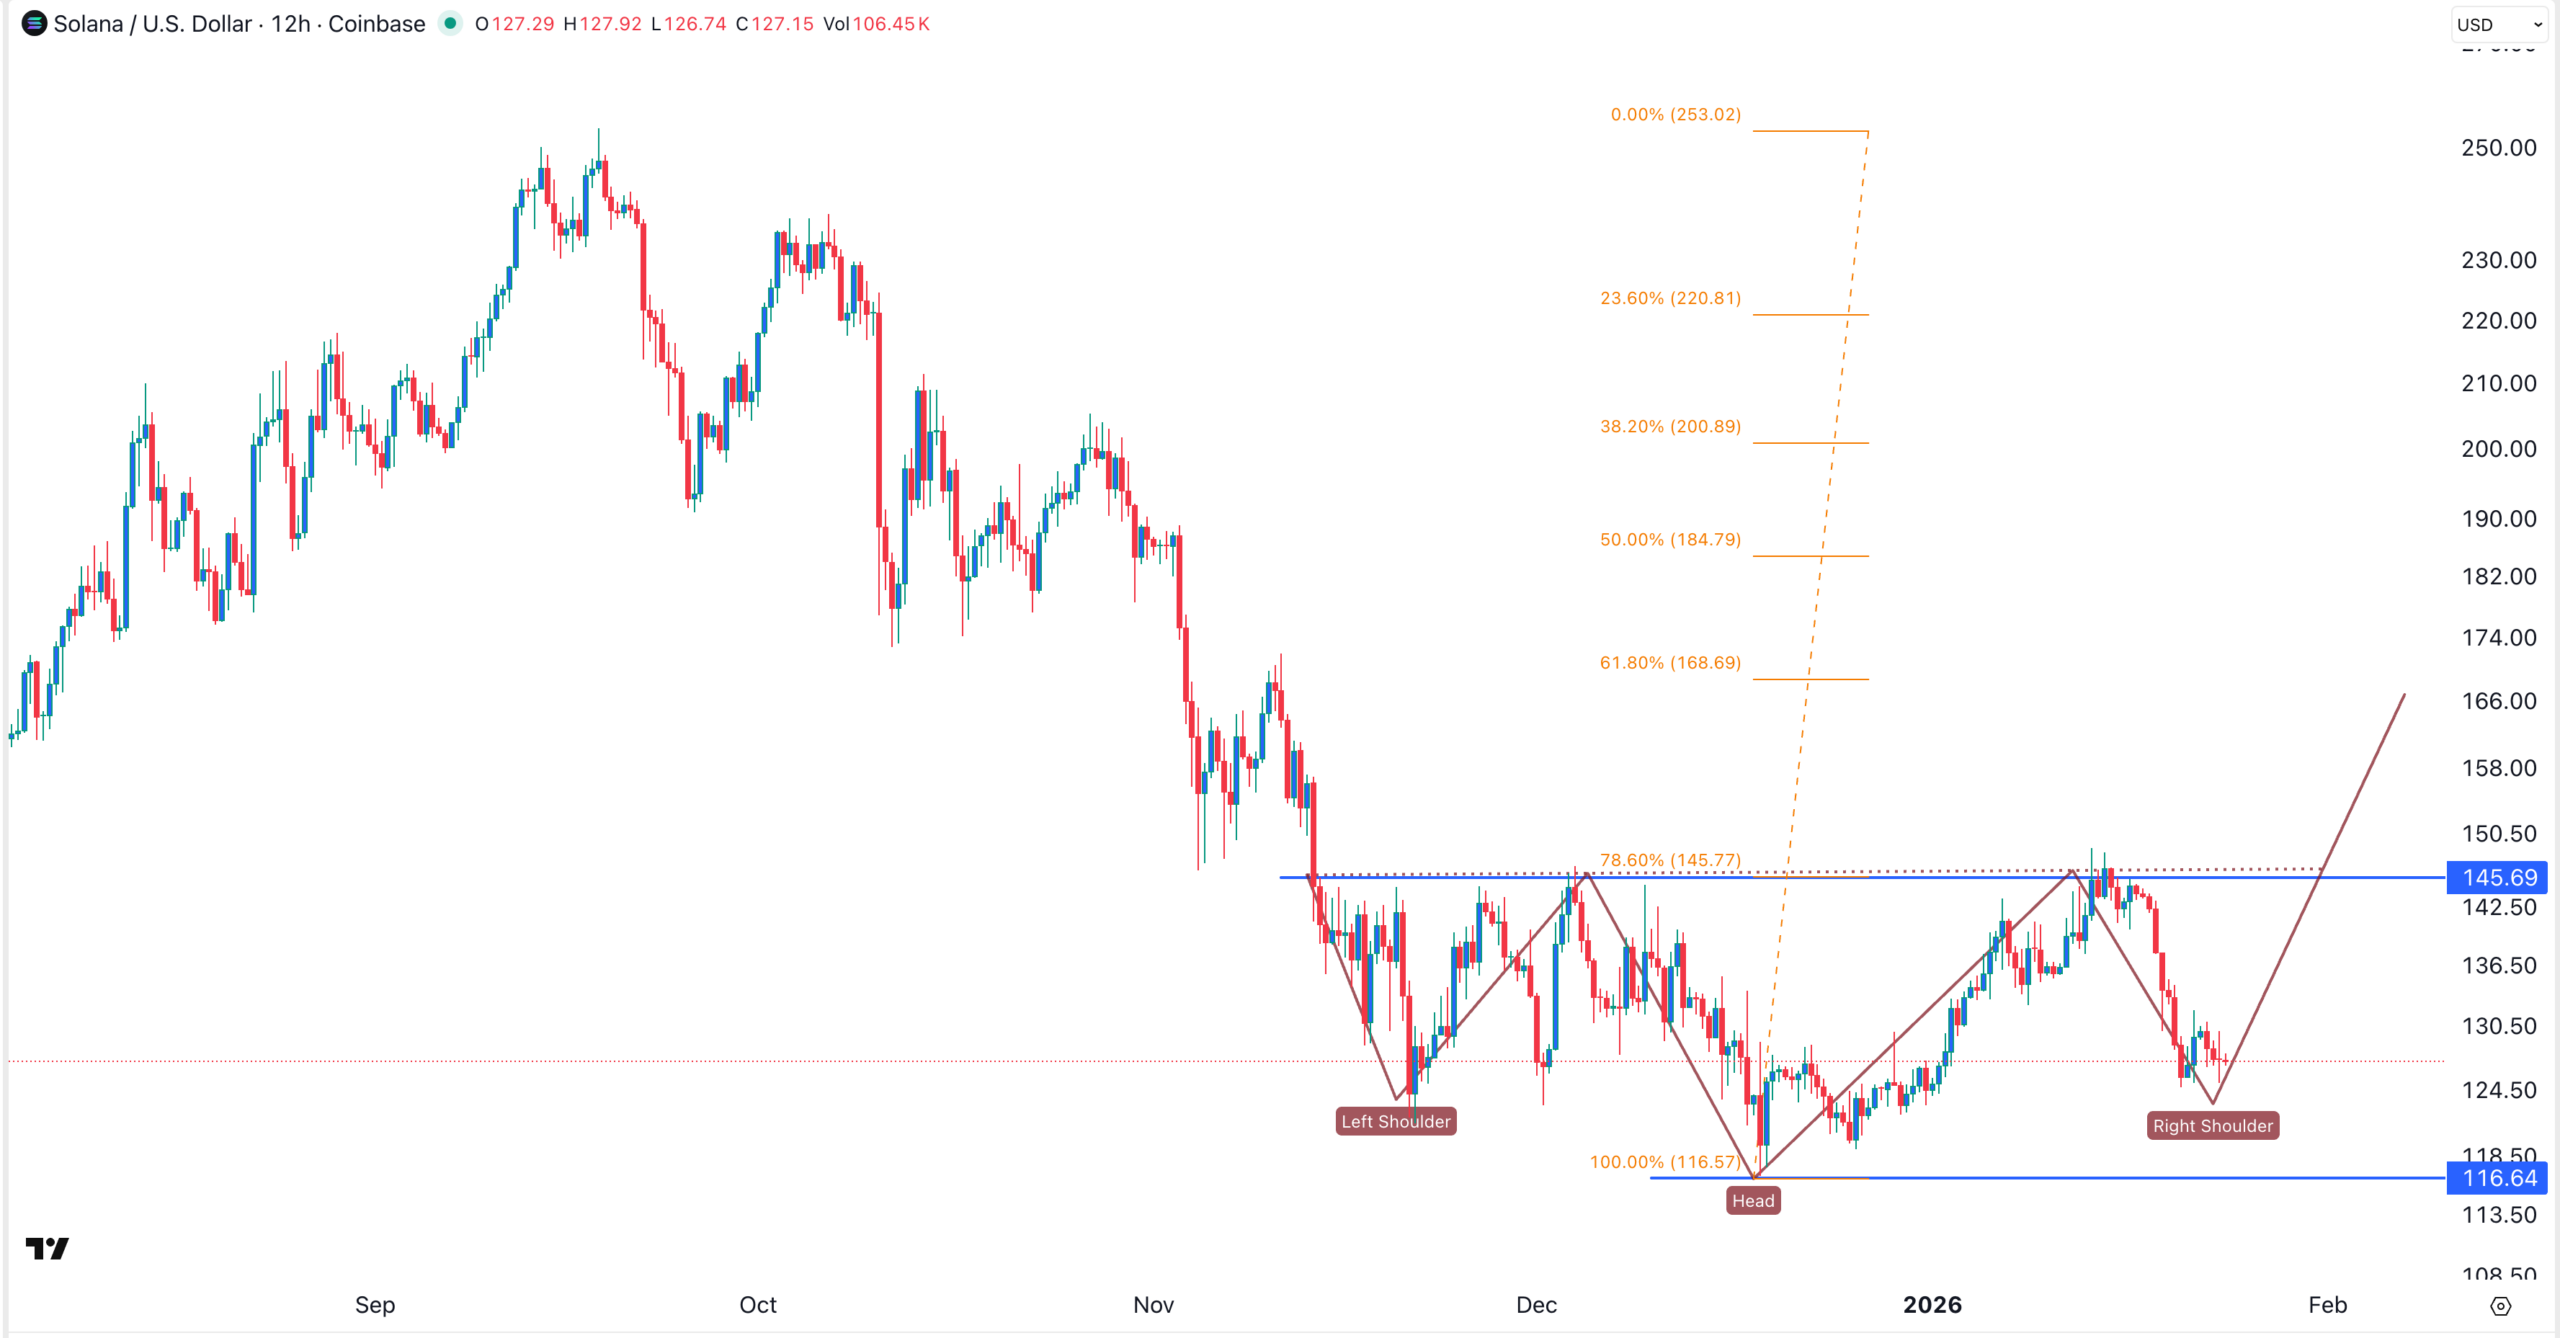
A drop below the December low of $116 will invalidate the bearish outlook. It will signal more downside. Solana price may fall toward $100 in the near term.




