
 Pearl
Pearl Zylo Ecosystem
 Bitway
 Derive
 Walrus
 Quantus
 Pudgy Penguins

Solana price has dipped below $80 amid increasing macro pressure. Analysts are now looking at $74.11 and $50.18 as key support areas. Meanwhile, whale positioning and geopolitical risks are driving short-term direction.
Solana Price Breaks Trendline as $74.11 Support Emerges
Solana price recently broke below a long-standing ascending trendline on the 3-day chart. According to Ali Charts, this breakdown showed a change of focus to $74.11 and $50.18 as the next major levels.
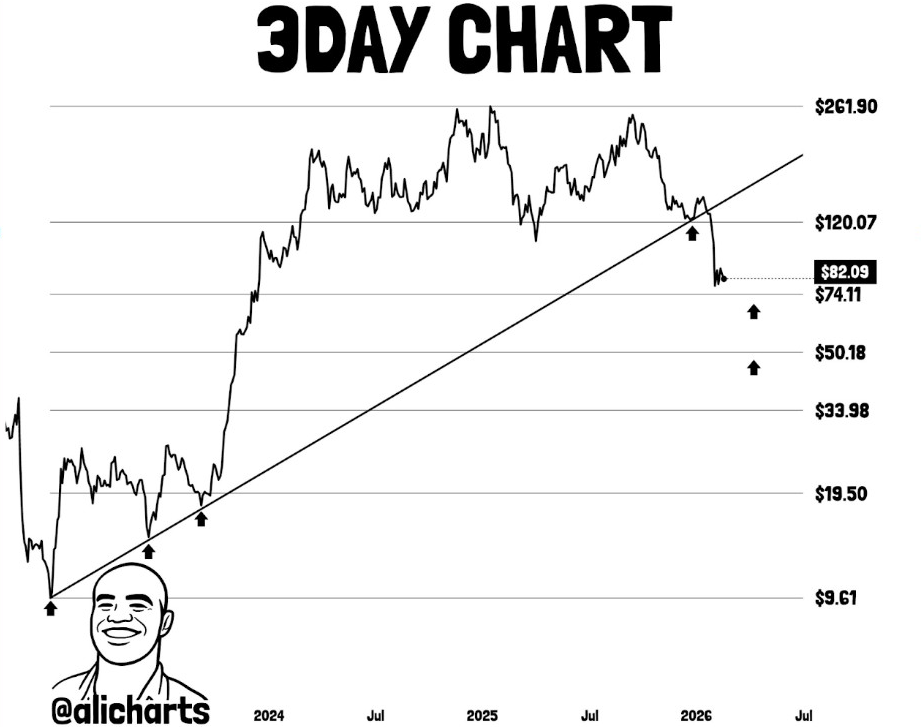
The chart saw SOL holding its previous range above the $120 area before it lost momentum. Once the trendline gave way, the price quickly slid to the low $80s. That move confirms a weakening structure on higher timeframes.
Ali Charts mentioned $74.11 as the first critical level to watch. A move below it in a sustained fashion could open the door towards $50.18. This lower zone basis is in line with historical support and prior consolidation.
Currently, Solana price is in the $80-$85 area. That area now becomes short-term resistance. Bulls need to reclaim this zone to stabilize sentiment. Without a strong recovery above the former support, the technical bias is cautious.
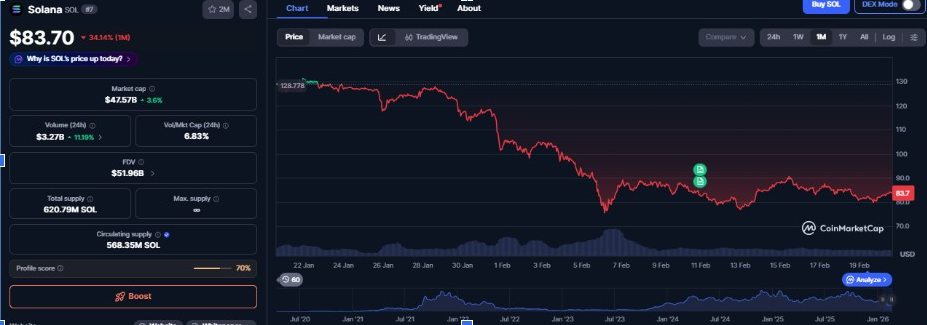
Therefore, traders are watching the reaction of SOL price towards $74 in the next few sessions.
Elliott Wave Structure Points to $76.50 Invalidation Level
Furthermore, More Crypto Online offered a lower timeframe view using Elliott Wave analysis. SOL price recently achieved a technical 100% extension target, and this represents an inflection point.
However, the analyst said a bottom must have evidence of a completed low to be confirmed. The invalidation level for the 1-2 setup is sitting at $76.50. A break below that level could invalidate the short-term bullish structure.
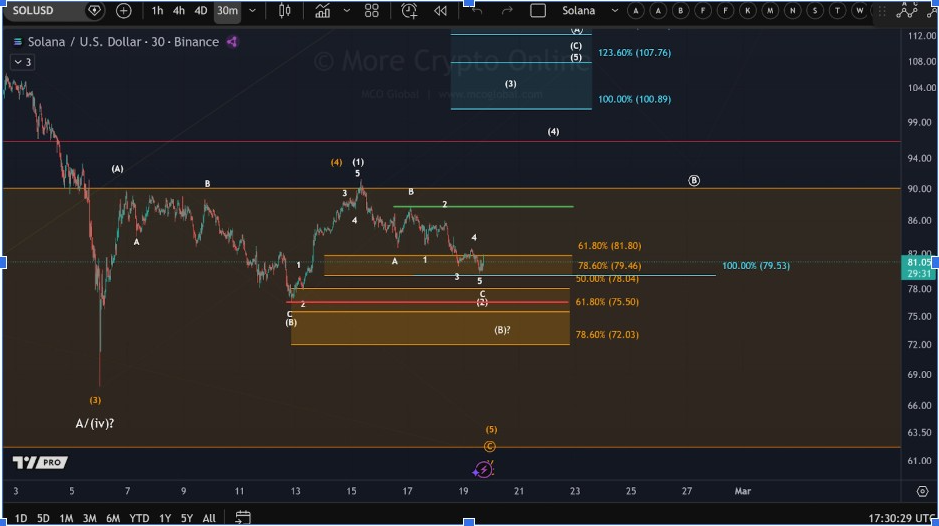
Fibonacci retracement zones ranging from $78 to $81 are also under test. These levels have been temporary stabilization zones. Yet the structure remains tenuous without ongoing buying pressure.
If Solana price manages to stay above $76.50 and recovers to $90, a corrective bounce can be formed. On the reverse side, a strong break lower could accelerate the downside towards Ali’s projection levels.
Thus, technical signals indicate that SOL is at a very important decision point. Short-term stabilization must be implemented promptly to prevent further losses.
Whale Activity Adds Bearish Pressure to Solana Price
On-chain data revealed that at least one large whale opened a significant short position. Reports show a $28 million SOL short at 20x leverage, alongside a massive ETH short.
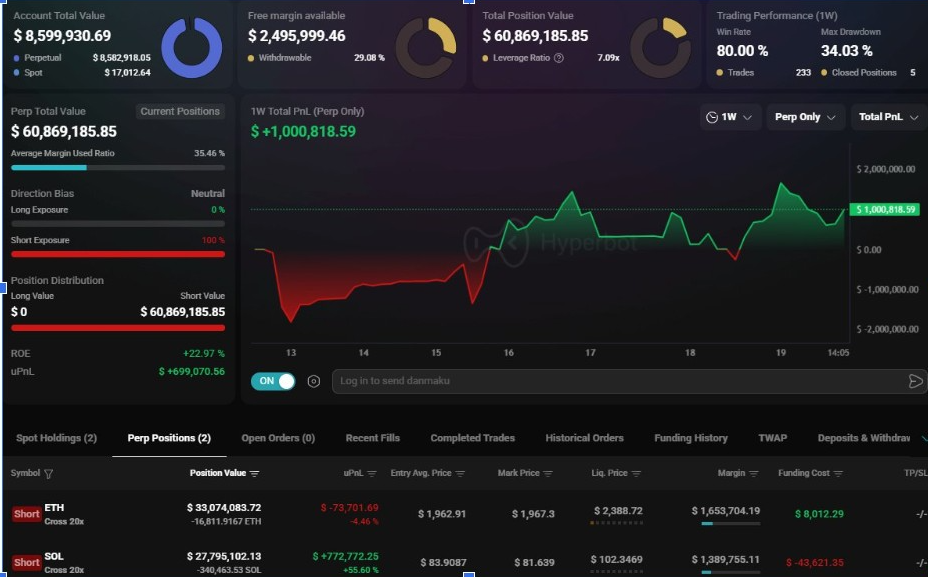
According to the trader, he has an 80% win rate over the past few months. That performance has left some speculation as to whether informed positioning is taking place.
High-leverage short exposure increases volatility risk. If Solana price attempts to rally, short covering could fuel a sharp rebound. However, persistent downward pressure may confirm the bearish position.
Funding rates and perpetual positioning information are indicators of cautious sentiment. Traders seem reluctant to pile in aggressively until a better structure forms.
Large players usually influence the short-term direction. Therefore, whale positioning continues to be an important variable in the near-term trajectory of SOL.
Macro Tensions and Oil Surge Weigh on Risk Assets
Broader macro factors are contributing to the technical weakness. Oil prices rose to more than $66 per barrel on rising geopolitical tensions. Reports of increased United States military activity in the Middle East have contributed to increased global uncertainty.
Bitcoin dips below $60,000 in the same time. Solana price fell below $80 as the risk appetite worsened. This correlation highlighted the impact of macro-driven liquidity changes.
Often, when oil prices spike, inflation expectations tend to rise. That dynamic can exert pressure on risk assets, such as cryptocurrencies. As a result, traders have decreased their exposure.
Geopolitical stress tends to increase volatility. Even technically sound assets can struggle under conditions of uncertainty. Therefore, recovery of SOL may be partly dependent on stabilization in world markets.
Despite present weakness, long term structure remains intact above $50. However, short-term momentum clearly is on the side of caution. The $74.11 and $50.18 levels now have a more widespread downside roadmap.



