
 Zylo Ecosystem
 Walrus
 Pudgy Penguins
 Pearl
Pearl Bitcoin
 Aerodrome Finance
 Quantus

Bitcoin’s price is consolidating around the $68,000 to $69,000 range after a sharp drop from $95,000, with volatility now compressing. Several BTC crypto charts points to a market that has changed from capitulation to tight-range trading. As a result, the near-term Bitcoin price prediction now depends on whether BTC manages to break through overhead supply and reclaim the $72,000 area.
ETF Inflows Rebound as Bitcoin Price Stabilizes
The data shared today showed that BlackRock’s Bitcoin Trust (IBIT) added about $1.054 billion in holdings. It said the move was the fund’s largest single-day gain since October. The same update revealed that other US spot Bitcoin ETFs also saw positive flows, with totals near $1.95 billion.
Notably, the flow rebound followed a tense weekend linked to US attacks in Iran. The post said Bitcoin rose back above $69,000 after dipping toward $63,000. It also quoted a trading volume figure of around $3.9 billion for IBIT.
This inflow story is significant because it provides a demand-side anchor while price is compressing. In tight ranges, steady inflows can support bids under dips. However, BTC still needs a clean break above resistance to rally.
BTC Wedge Breakout Setup Puts $82K in Focus
Also, Satoxis said BTC is breaking out of its wedge after weeks of compression. The analyst noted that the descending resistance has been reclaimed and mapped a measured move to $82,000.
The 4-hour chart indicated that BTC broke above a down-sloping trendline. This pattern suggests the market is moving from consolidation to expansion.
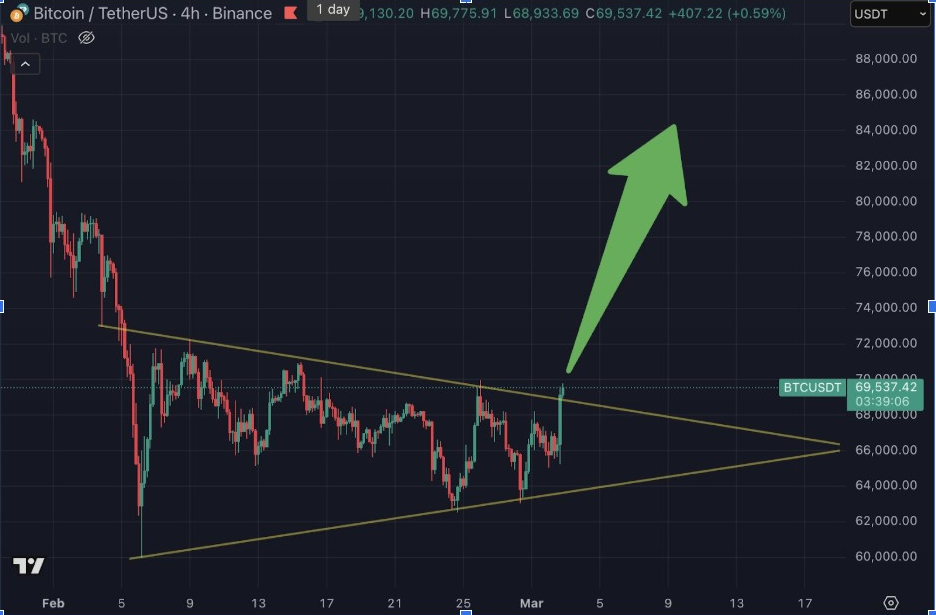
Wedge breaks very often require follow-through to prevent a fade back into range. That makes the nearby resistance zones critical. If BTC stalls near the breakout line, traders may interpret the move as a liquidity sweep.
Bitcoin Price Prediction Hinges on $72K Resistance
Cyril-DeFi mapped out a consolidation of BTC around $68K to $69K after a sharp drop from $95K. The post set had resistance in the $71.8K to $74K area. It also indicated $56K as a significant support zone.
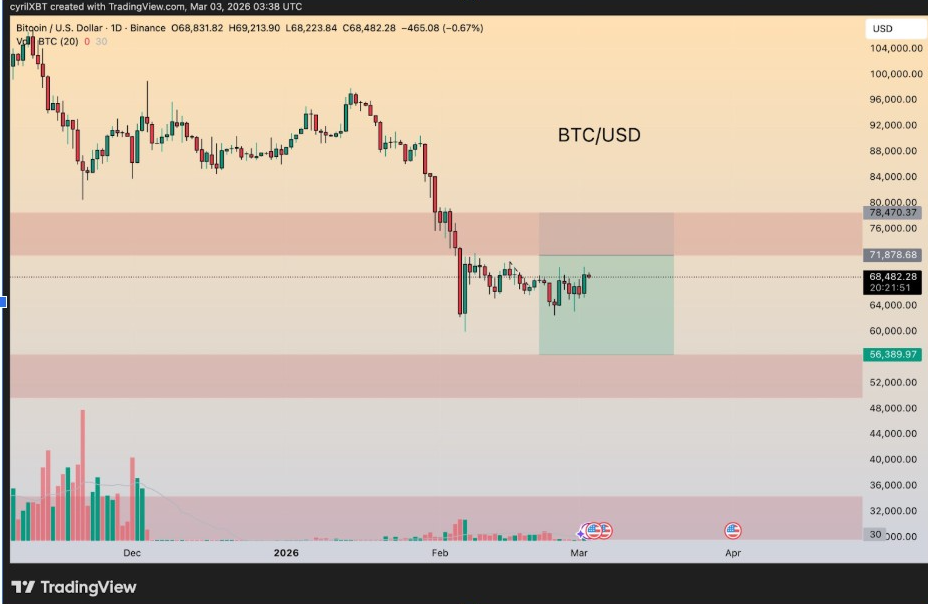
The post’s description of current behavior is that of a tight range after capitulation. It said volume has been cooled and volatility compressed. That matches the daily chart, where candles are clustered in a narrow band.
Cyril-DeFi further provided a trigger for the next move. A break above $72K could push BTC towards $80K quickly, the post said. However, the loss of the range could mean a test of mid-$50Ks liquidity.
URPD Levels Highlight $68,160 Pivot and 84K Targets
Meanwhile, Ali Charts posted a Bitcoin URPD view that plotted important resistance levels above $68,160. The post said that above $68,160, the next important resistance levels are $83,307 and $84,569. Those levels showed up as large bars with heavier supply overhead.
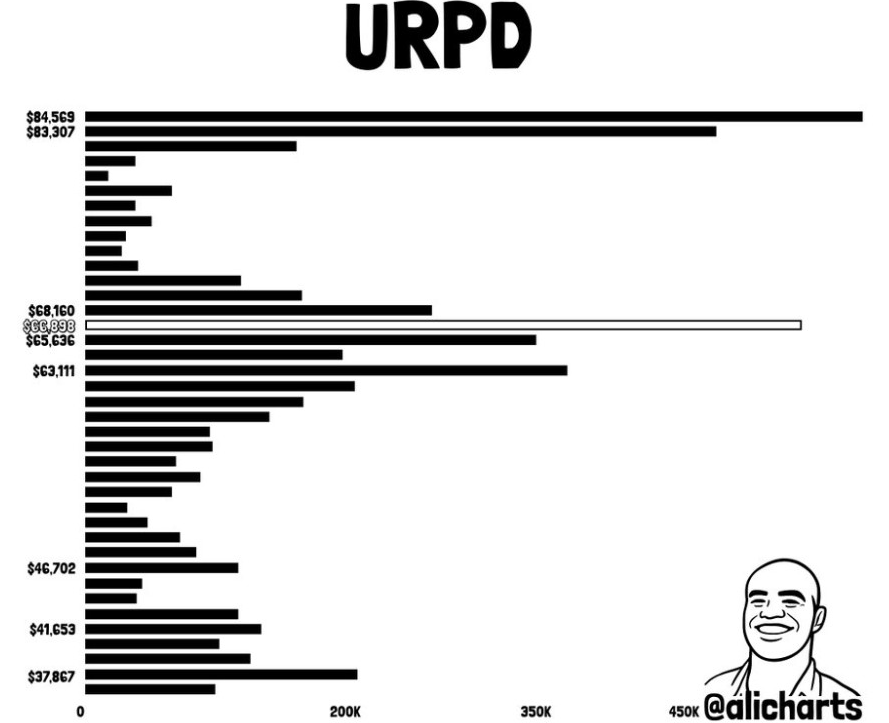
The same profile also highlighted levels inside the current zone. It showed $65,636, $66,898, and $68,160 as the notable bands. It also had a lower reference point of $63,111.
URPD charts often show where coins last moved, which can serve as supply-and-demand zones. In this context, breaking $68,160 becomes an important step for BTC’s momentum. If BTC can hold that pivot, it can reduce friction during pullbacks.
The higher targets around $83K to $84K also line up with the wedge move narrative. Together, these levels will determine the next Bitcoin price prediction path if BTC breaches the $72K resistance band.



