
 Zylo Ecosystem
 Pearl
Pearl Walrus
 Derive
 Quantus
 Aerodrome Finance
 Sui
Sui

Bitcoin (BTC) is hovering around $67,000 following a sharp reset from the mid-$80,000 range, and traders are now keen to see whether the market can reclaim $70,000. Recent chart configurations indicate a small short-term trading zone where resistance is concentrated between $68,700 and $70,000, and wider support is on the line from the mid-$60Ks into the low $60Ks. The combination suggests Bitcoin’s price is at a critical crossroads, and analysts are monitoring its ability to overcome overhead selling pressure and regain momentum.
Bitcoin Price Meets First Resistance Wall
Bitcoin’s price is stabilizing around $67,000 after losing support at higher levels during the earlier slide from the mid-$80,000 region. His chart places current action near a local support cluster, while a broader demand area remains visible in the low-$60,000 range. That setup suggests the market is pausing rather than confirming a full recovery.
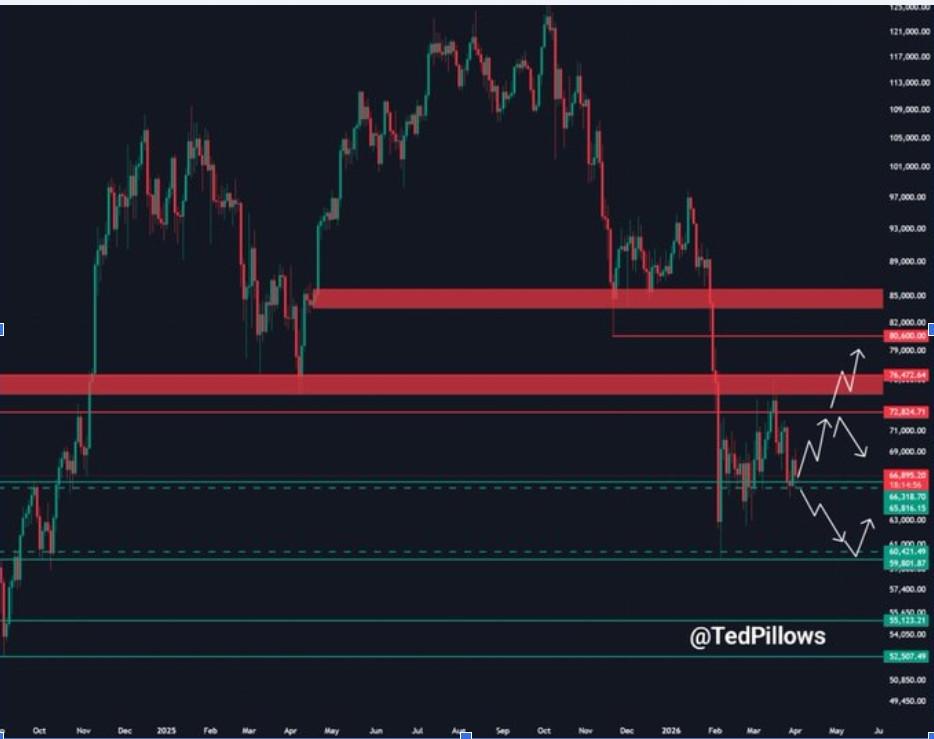
Moreover, Ted’s resistance map shows why the next move matters. The chart marks $69,000 to $70,000 as the first major reaction zone, followed by resistance near $73,000, then a broader supply band from $76,000 to $77,000. In that structure, even a modest rebound in BTC price still faces layered selling pressure before bulls can regain control.
In addition, the chart outlines multiple paths. One route shows a brief recovery into resistance before another rejection, while another suggests sideways trading followed by a drop toward the mid-$60,000s or lower. Bitcoin price needs to break and hold above $70,000 before the short-term tone improves materially.
Monthly Chart Keeps Macro Bullish Structure
Meanwhile, Trader Tardigrade takes a broader view and places Bitcoin price inside a repeating monthly cycle. His chart separates prior moves into “steady uptrend” and “choppy but euphoric.” phases. The analyst suggests that the current market fits within the broader category where volatility rises, but the long-term trend remains intact.
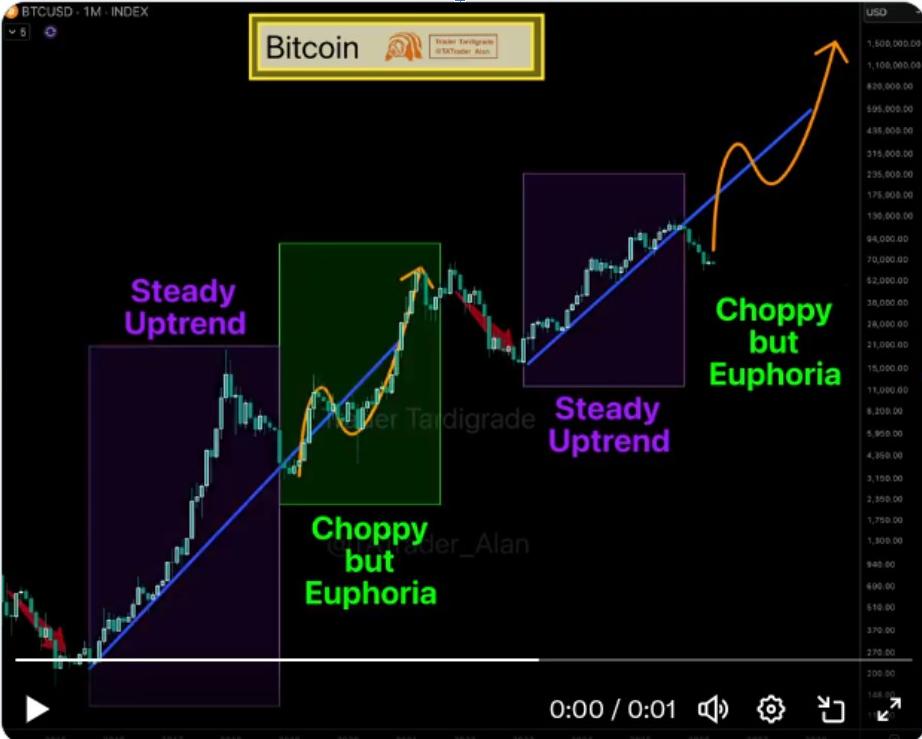
According to the structure, current weakness signals a continuous cycle. The chart shows that Bitcoin is following an upward long-term trendline. In the meantime, smooth advances indicated by previous cycle boxes suggest that consolidation commonly succeeds a smooth advance before a stronger expansion period begins. That puts the recent volatility in the context of a larger bullish trend, rather than a complete reversal of the structure.
Furthermore, Trader Tardigrade’s forecast projects a steeper climb, followed by stronger upside growth in the cycle. This is not a timing call, but it indicates that the market may be volatile and could still deliver long-term upside. In that context, a delayed breakout above $70,000 would still fit the broader chart framework.
Daily Setup Keeps $68,700 in Focus
CRYPTOWZRD’s daily chart is the most tactical, placing immediate attention on $68,700. He notes that BTC price closed indecisively and remains below that resistance while holding above support near $64,000. That leaves Bitcoin in a narrow daily range after the February drop, with direction still unresolved.
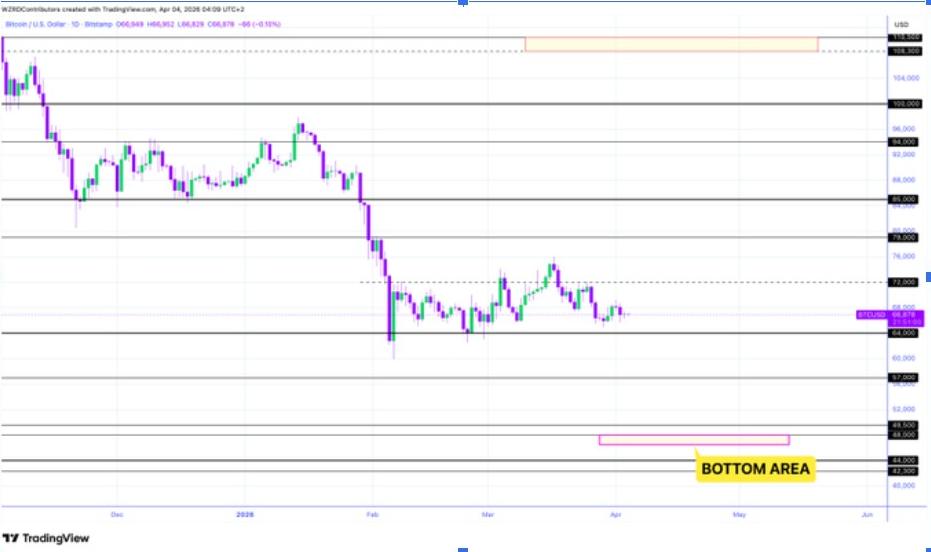
According to his setup, a rally to $68,700 that fails again could create a fresh short opportunity. The chart shows repeated hesitation below higher levels, such as $72,000 and $79,000, while Bitcoin remains well under the broken $85,000 area. A failed retest would keep the lower-high pattern intact and could shift pressure back toward $64,000.
Additionally, he points to a second bearish trigger. If BTC price stays below the resistance and breaks down from the intraday widening wedge, downside zones remain open toward $57,000, $49,500, and even the marked bottom region in the high-$40,000s. For now, Bitcoin price remains in a compressed zone where a break above $68,700 to $70,000 would challenge the bearish short-term setup, while another rejection would reinforce it.



