
 Pearl
Pearl Walrus
 Bitway
 Bitcoin
 Quantus
 Quant
Quant Pudgy Penguins

Ethereum price traded near $2,121 after slipping 0.62% on the day. The token remains below the key $2,150 level, keeping short-term pressure on bulls. However, whale accumulation and holder inflows indicate that larger investors remain active during the pullback.
Ethereum Price Prediction Faces $2,150 Test
Ted Pillows said Ethereum price is still struggling to reclaim the $2,150 level. His chart showed ETH crypto sitting below the same zone that recently flipped from support into resistance, making it the first level bulls need to recover.
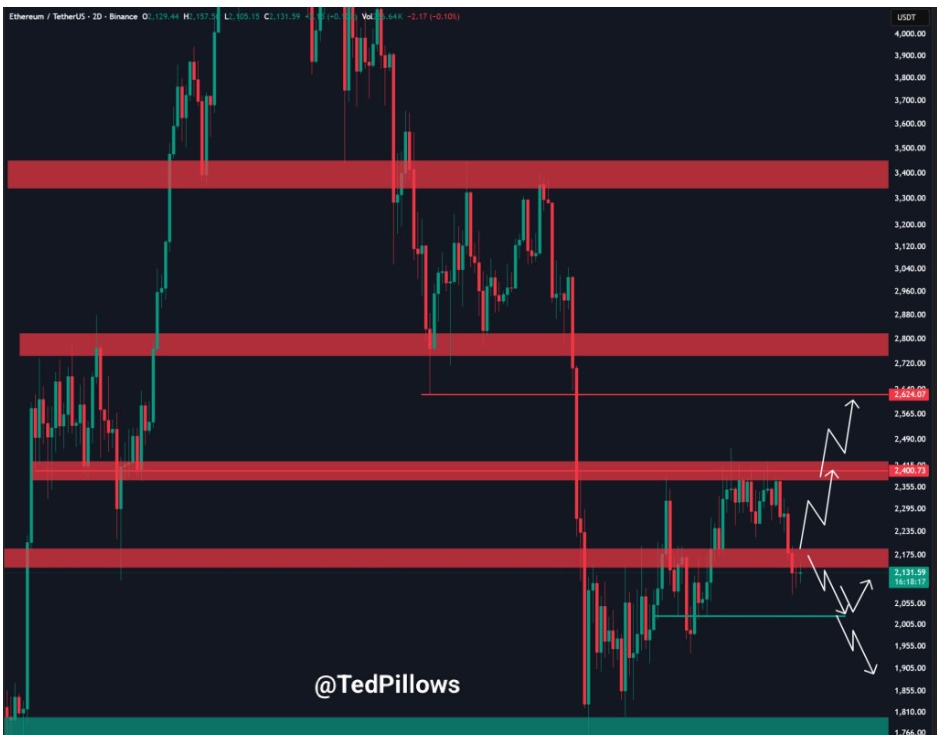
A reclaim of $2,150 could improve short-term sentiment and open the way toward $2,250. That move would not confirm a full trend reversal, but it would show that buyers are absorbing recent selling pressure. From there, ETH would still need to push through higher resistance near $2,400.
If Ethereum price fails again near $2,150, the risk of another decline increases. The chart showed a possible downside first toward the $2,050 region, followed by a deeper move if buyers fail to defend that area. This keeps ETH crypto in a fragile position, despite the modest intraday recovery attempts.
Price action also remains below the broader supply band near $2,400. That area has rejected ETH several times, so bulls need more than a small bounce to change the structure. Until that happens, Ethereum price prediction remains tied to whether $2,150 turns back into support.
ETH Crypto Corrective Structure Limits Confidence
Looking at the broader chart, More Crypto Online noted ETH bulls are getting excited again, but the current move still looks corrective. The analyst noted that Ethereum continues to lag behind Bitcoin and remains below major resistance, making the bounce difficult to fully trust.
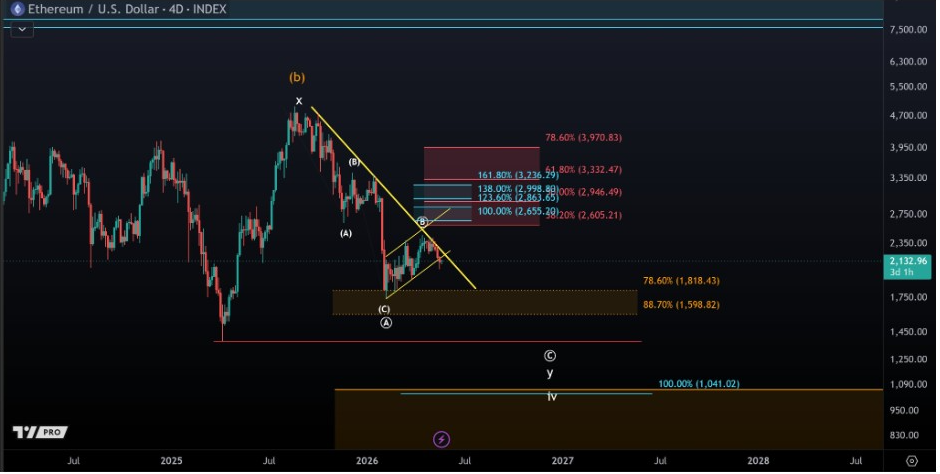
The chart showed Ethereum price trading within a larger corrective setup. A move toward the $2,600 to $2,655 region remains possible if ETH crypto breaks nearby resistance. That zone remains a major test for buyers. It does not confirm a breakout by itself.
Ethereum still needs to reclaim resistance with clear strength to lower the risk of another drop. If the bounce fades near that area, sellers may step back in, especially if Bitcoin loses momentum again.
On the downside, the analyst highlighted support near $1,800, $1,600, and $1,000. A break below the February low would increase the probability of a deeper decline toward the $1,400 to $1,000 region. That makes the current recovery attempt important, but not yet convincing.
Buy and Sell Walls Trap ETH
At the same time, CW said Ethereum price is stuck between buy and sell walls in the short term. His chart shows ETH crypto moving sideways between a red resistance zone above and a green support zone below.
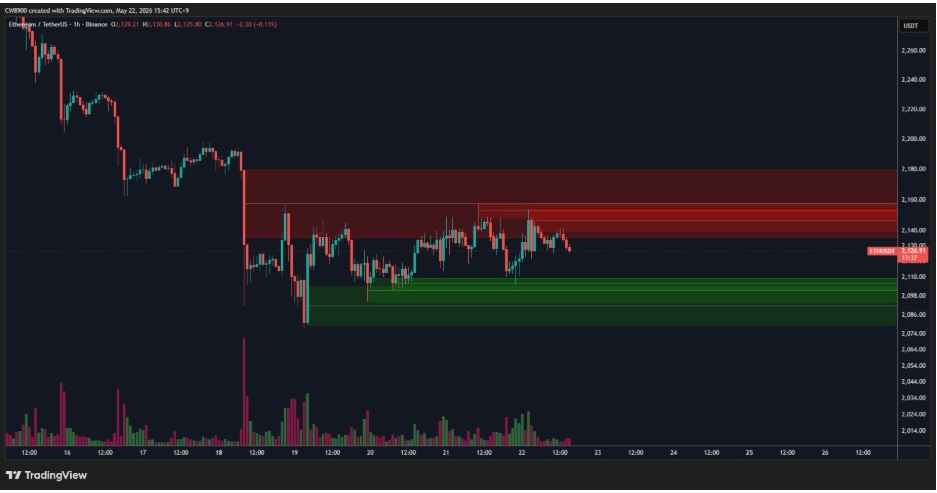
This setup pointed to a market waiting for an imbalance. As long as buy and sell pressure remain balanced, ETH may continue to move sideways. However, volatility could increase once either side gives way.
The nearby sell wall appears around the $2,140 to $2,180 area, while buying support sits closer to the $2,090 to $2,105 region. That range explains why ETH has struggled to move cleanly in either direction.
A break above the sell wall could help ETH price retest $2,150 and later $2,250. However, a drop below the buy wall may return the price toward $2,050. For short-term traders, this narrow range now controls the next move.
ETH Whales Continue to Accumulate
Even so, on-chain data gives bulls one supportive signal. Rios noted that Ethereum’s nearly 19% drop may be a cycle reset rather than the end of its broader structure. He said long-term holders continue accumulating while ETF expectations and on-chain activity remain strong.
Santiment data in the shared chart shows exchange-excluded whale supply near 125.02 million ETH, even as price trades close to $2,135. This suggests large holders have not abandoned their positions during the pullback.
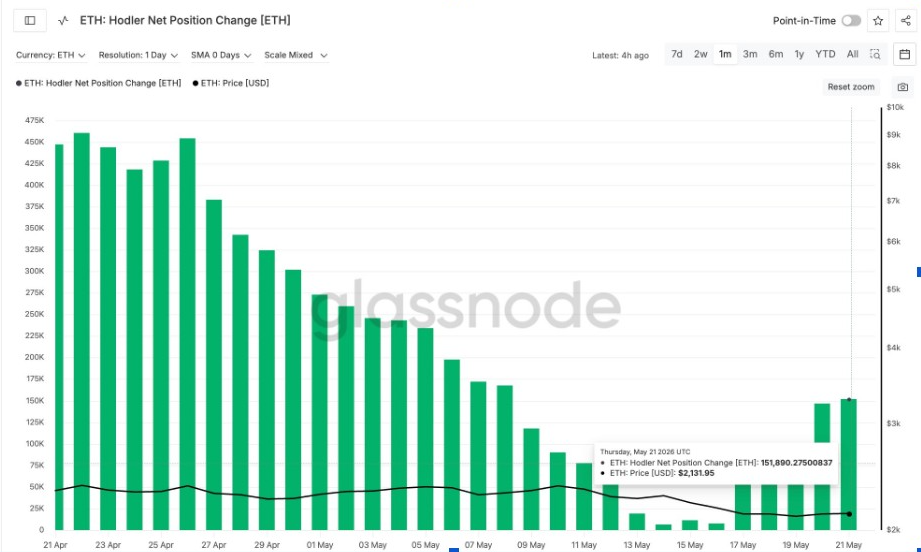
Glassnode data showed ETH holder net position change near 151,890 ETH on May 21. That means holders are still adding ETH, even while the price remains under pressure. During a sharp pullback, this kind of behavior often shows that longer-term buyers are not leaving the market.
Still, accumulation does not remove the near-term risk. ETH needs to move back above $2,150, absorb the sell wall, and gain strength above $2,250. Without that move, sellers could keep control and push the price toward $2,050. A deeper drop could also bring $1,800 back into focus.


