
 astronaut
 Pearl
Pearl Zcash
Zcash Walrus
 NEAR Protocol
 Starknet
 Pudgy Penguins

Solana price attempted to stabilize after defending a major support area near $65. SOL traded above $67 after buyers returned at levels that previously attracted demand. Analysts continue monitoring the broader $40–$60 range as a potential accumulation area. Despite the recent market weakness, network activity has remained relatively stable. However, SOL still faces resistance near $68 and $69 before a stronger recovery can develop.
Solana Price Prediction Tracks Key Fibonacci Zone
Crypto analyst Crypto Patel identified Solana’s current position within the 0.5 to 0.618 Fibonacci retracement range. The weekly chart places these levels near $70.30 and $50.02, creating a broad zone where long-term buyers may seek exposure.
SOL entered a similar technical range during an earlier market cycle before rallying by more than 2,200%. Patel used that historical move to outline a possible recovery path toward $1,000. Still, past price performance does not guarantee that Solana will repeat the same percentage gain.
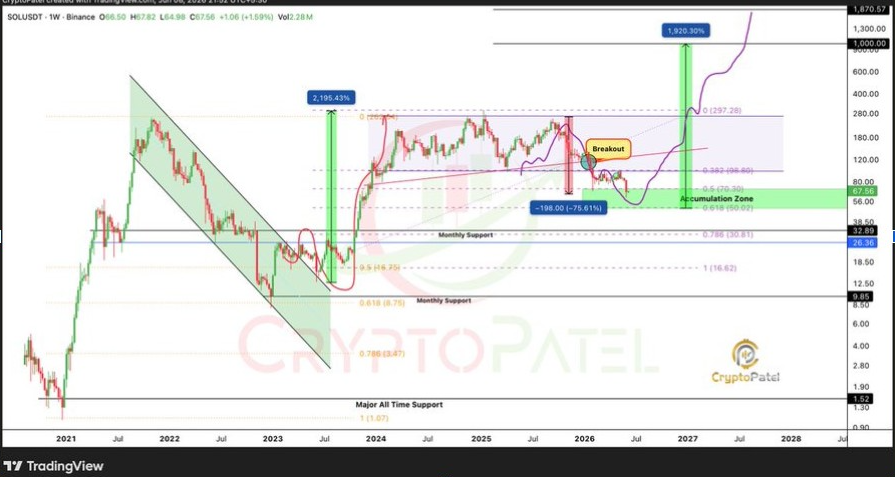
The chart marks $40 to $60 as the main accumulation zone. Solana recently traded above this area after recovering from a weekly low near $64.98. Buyers also defended the upper boundary of the broader demand range, keeping the long-term structure intact.
A sustained decline below $60 would weaken that setup and expose lower support levels. The chart places monthly support near $32.89 and $26.36. Another major support area appears close to $9.85, though SOL would need to record a much deeper decline to reach that level.
SOL Crypto Rebound Faces Resistance Near $69
Solana gained more than 3% after buyers provided support between $64 and $66. That reaction suggests sellers lost some control near the weekly low.
Even so, liquidation data shows concentrated leveraged positions around $68 and $69. A move above this area could trigger short sellers to exit their positions. The resulting buying pressure may help SOL climb toward the next resistance levels.
Failure to clear $69 may keep Solana inside its current consolidation range. Sellers could then test the $64 to $66 area again. A close below that support would increase attention on $60 and the wider accumulation range shown on the weekly chart.
Analyst Hardy also described Solana as oversold following several weeks of downward pressure. He expects Bitcoin’s price and market dominance to shape the next move. Continued capital concentration in Bitcoin may restrict demand for SOL and other major altcoins.
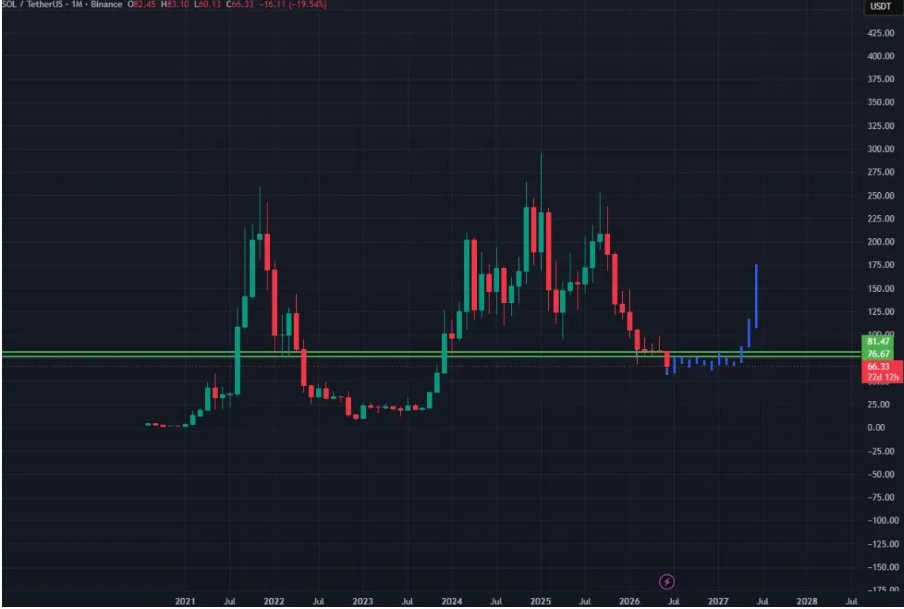
Hardy placed a deeper downside range between $33 and $40 under a more severe market scenario. Such a move would likely require another sharp Bitcoin decline and weaker conditions across the crypto market. For now, the $64 to $66 support zone provides the clearest measure of short-term demand.
$1,000 Target Requires a Larger Market Cycle
Crypto Patel’s chart suggests a possible move toward $1,000 if Solana repeats part of its earlier cycle. A rise from the current area to that target would represent a gain of roughly 1,300% to 1,400%, depending on the entry price.
Solana would need to overcome several resistance areas before approaching that level. The chart places major resistance near $98.80 and $297.28. SOL must also attract sustained capital inflows and benefit from stronger demand across the wider altcoin market. An altcoin season could support that path by moving capital from Bitcoin into larger digital assets.




