
 Pearl
Pearl Walrus
 Starknet
 Quantus
 Bitway
 Sui
Sui Zylo Ecosystem

Chainlink price fell for three consecutive sessions, retreating from $8.7410 toward $8.3820.
The pullback developed after LINK reached a key technical resistance area. It also formed a rising wedge pattern despite improving institutional and derivatives metrics.
The pattern raised the risk of a bearish breakdown. However, continued exchange-traded fund inflows and lower exchange reserves provided support for the wider outlook.
Chainlink Price Prediction: Technical Analysis
Technicals suggest that the LINK price may be at risk of a strong bearish breakout. It has retreated after hitting the 100-day Exponential Moving Average (EMA).
Worse, the Relative Strength Index (RSI) has turned around and moved from this week’s high of 64 to the current 55. It is also pointing downwards and is nearing the neutral point of 50.
Worse, LINK price has formed the risky rising wedge pattern, which is made up of two ascending and converging trendlines. The two lines are about to converge, which may lead to a strong bearish breakout.
Therefore, the token will likely continue falling, potentially to the important support level of $6.9827, its lowest level in June. A move above this week’s high of $8.6 will invalidate the bearish outlook and point to further gains.
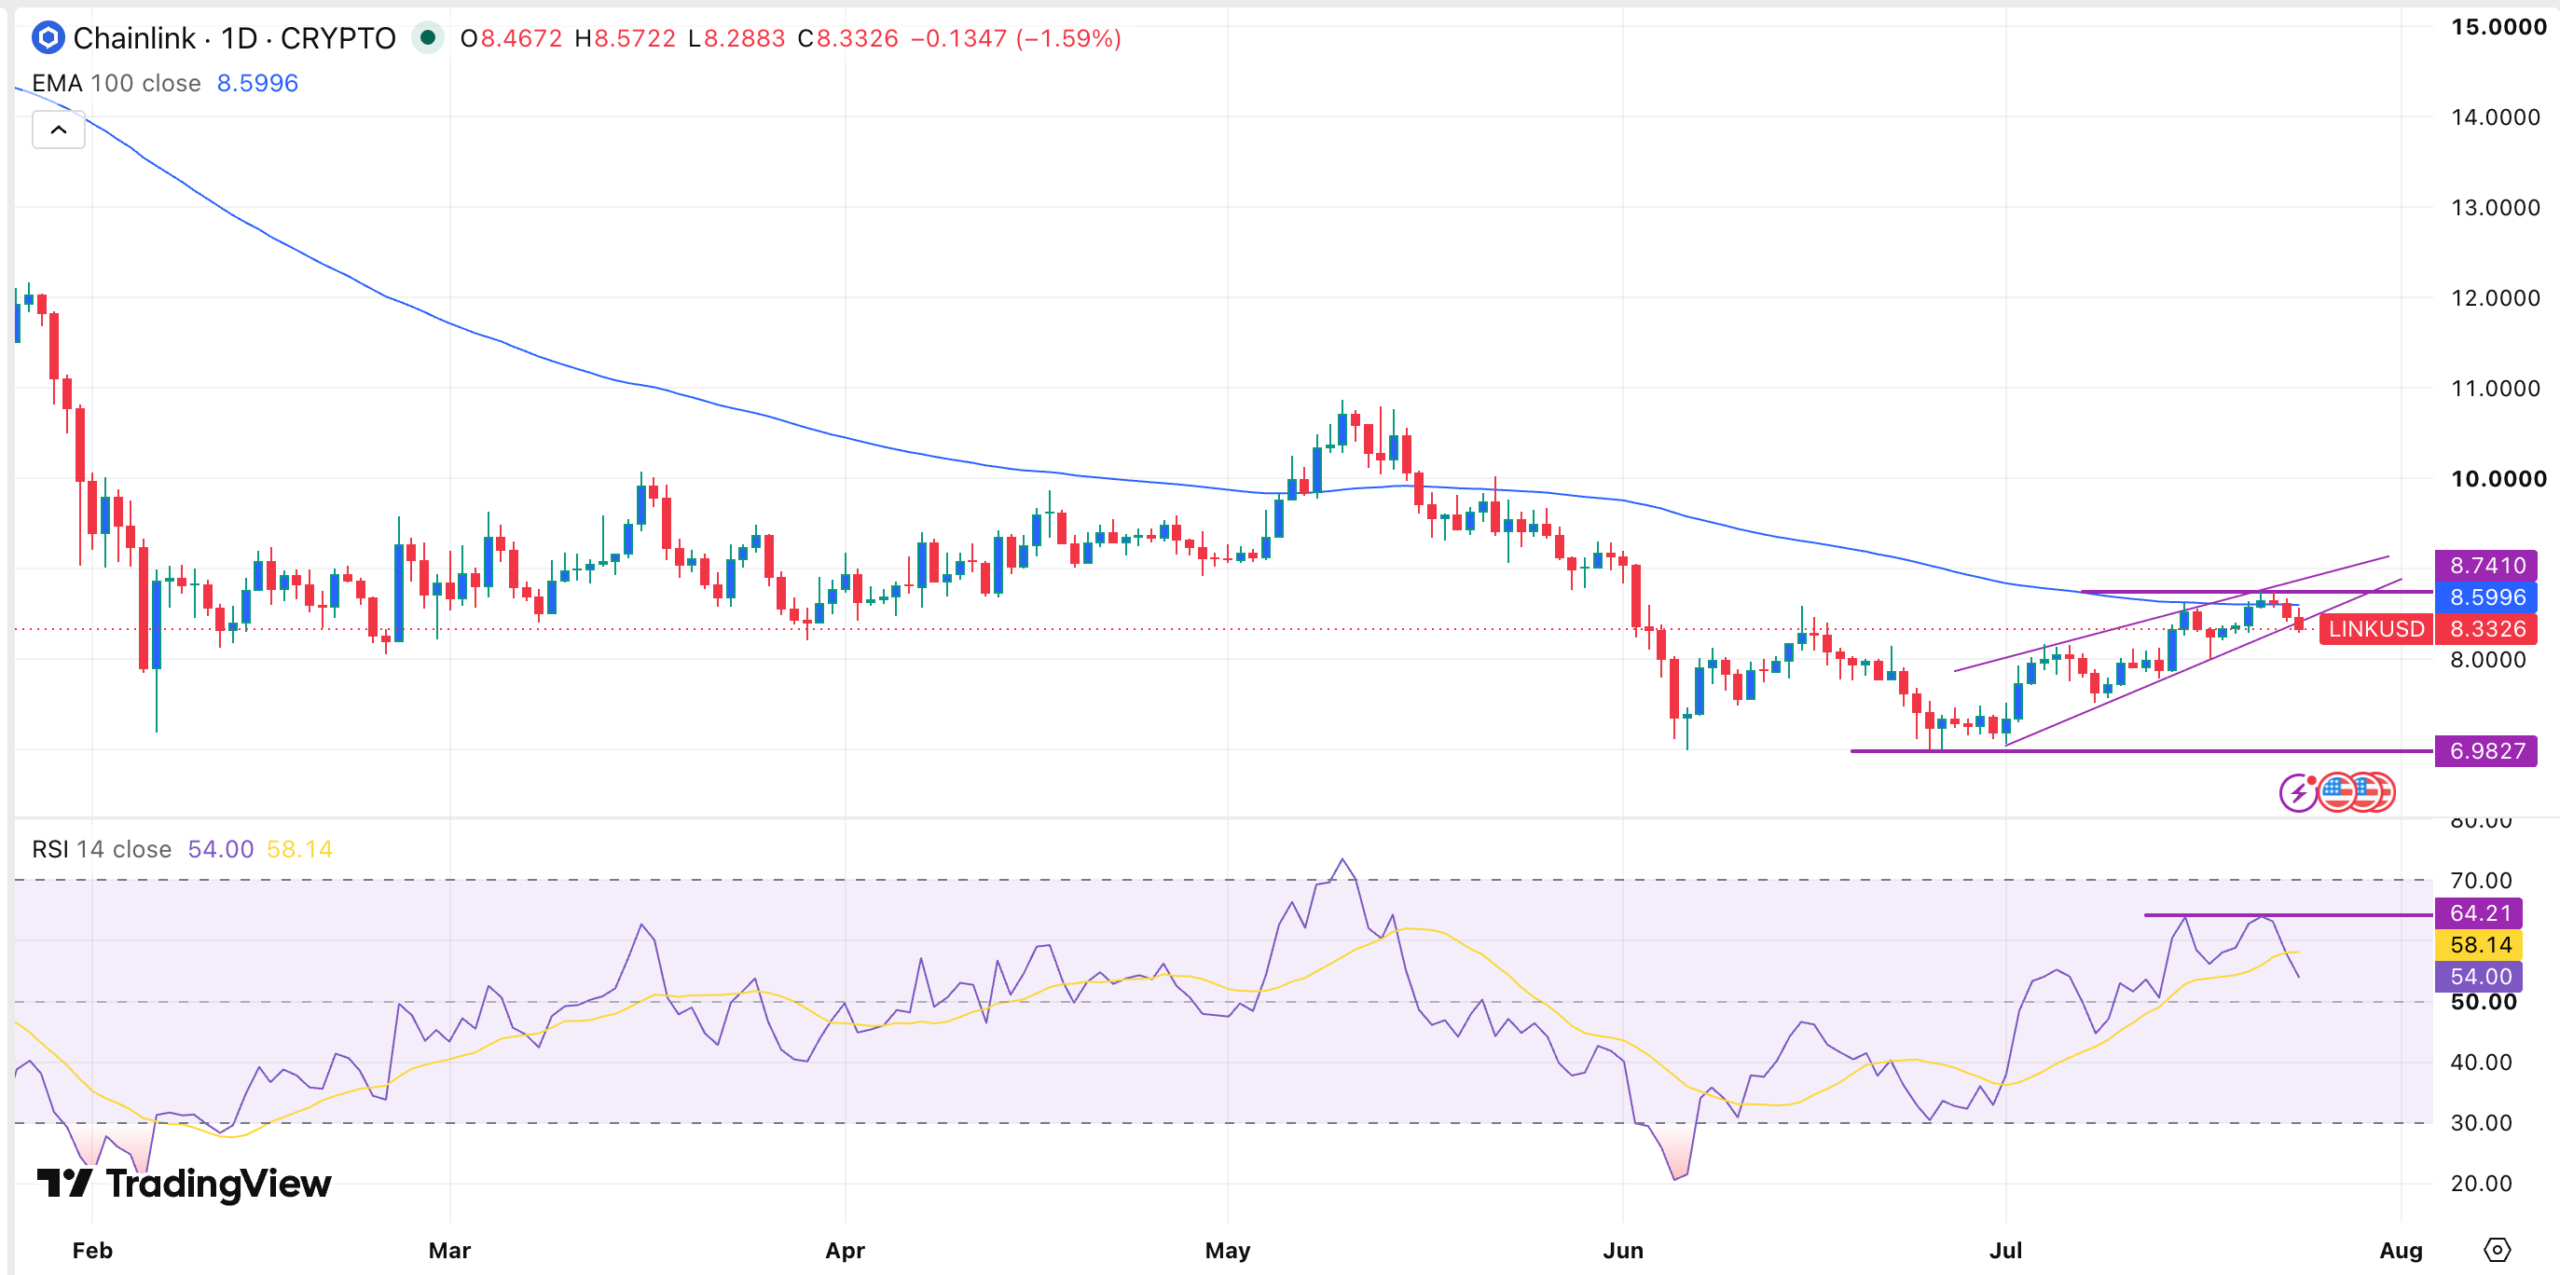
LINK price chart | Source: TradingView
LINK’s Fundamentals Have Improved
While Chainlink’s technicals are flashing red, there are signs that its fundamentals are still strong. As such, bulls will need to overcome these technicals to push its price higher in the near term.
One of the fundamentals is that its American investors have continued their slow accumulation. Data shows that these investors have continued adding assets in the past few weeks. They have added over $2.83 million in inflows this week, bringing the monthly flows to over $4.39 million.
These funds have had inflows in all consecutive months since December this year. They have had over $127 million in cumulative inflows and now have $112 million in assets. Their total assets are now about 1.77% of the market capitalization.
Spot Chainlink ETFs have accumulated over $67 million in assets this year, beating Ethereum and Bitcoin. Bitcoin ETFs have lost billions of dollars in assets, while ETH have shed over $1 billion this year.
Continued Chainlink ETF inflows is a sign that investors are optimistic about that the coin will bounce back. This is important because a significant amount of these buyers are institutions.
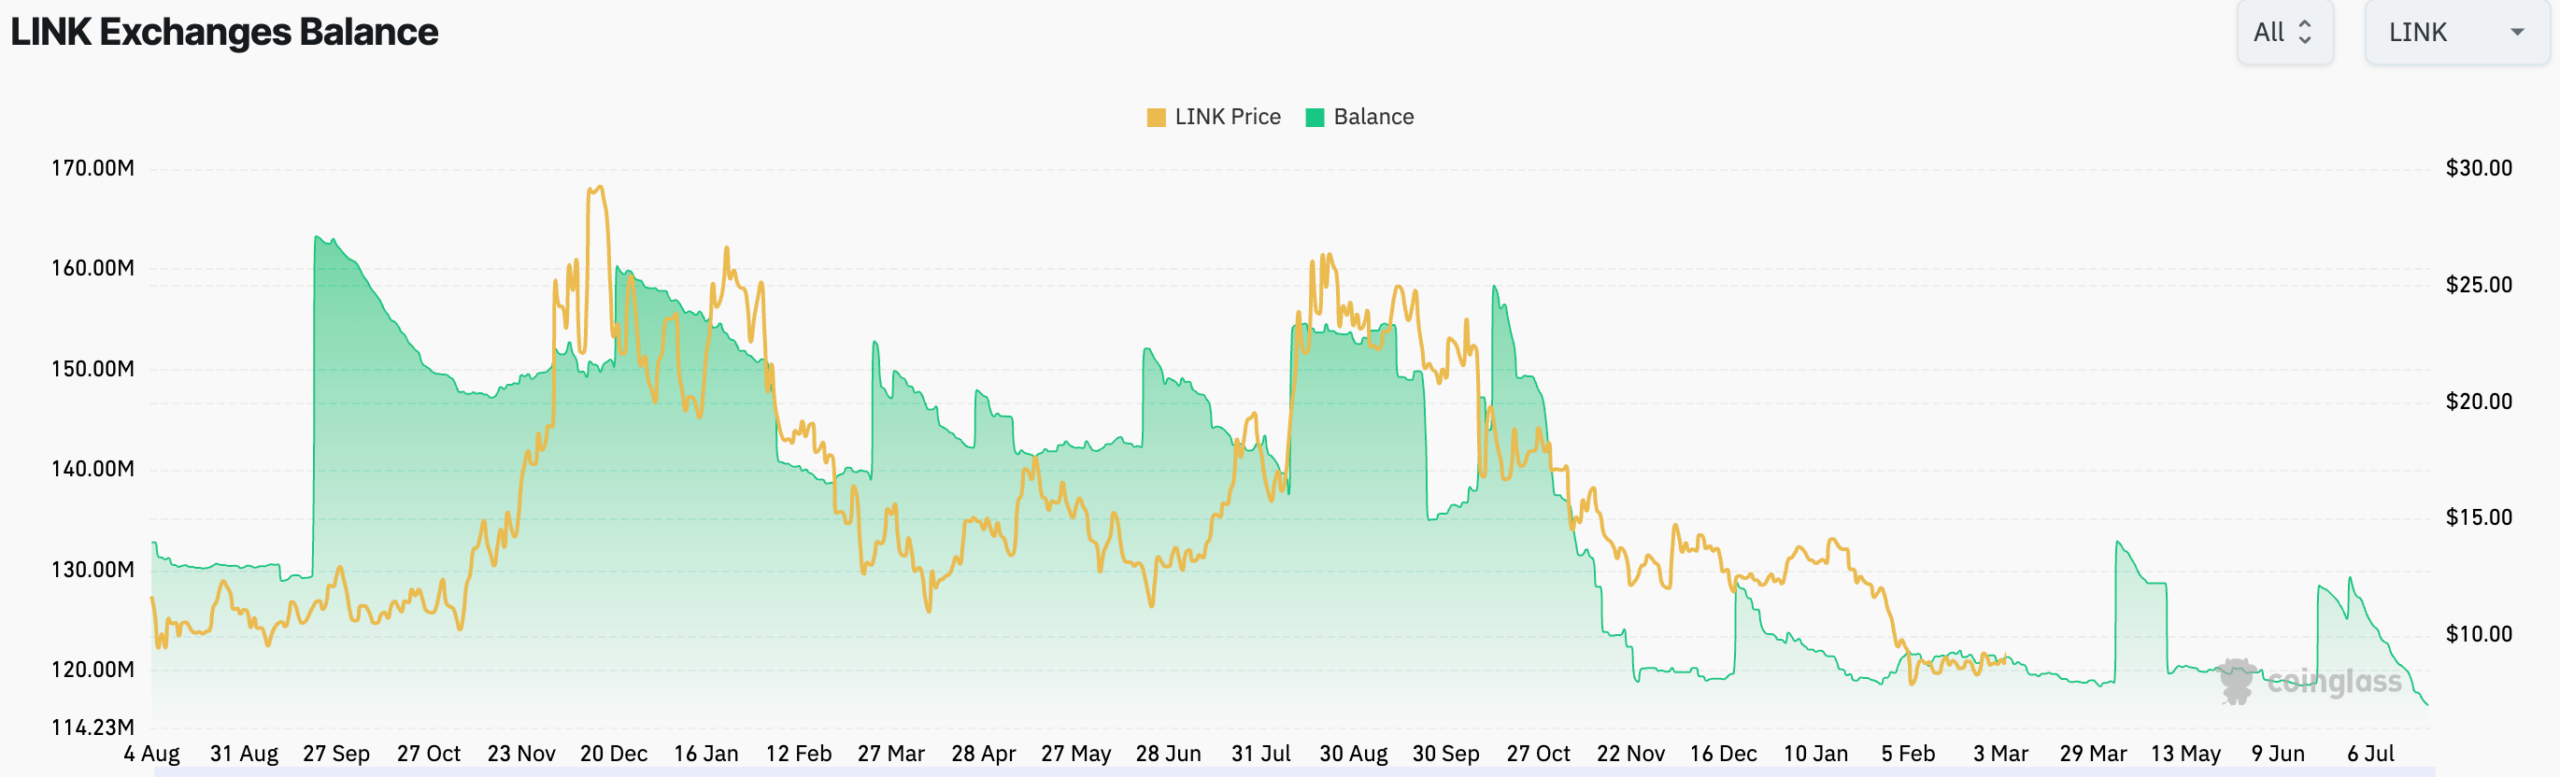
This buying explains why the LINK supply on exchanges has continued to fall, as the chart below shows.
LINK Futures Open Interest Soaring
Chainlink price is also falling even as activity in the futures market continues to boom. The futures open interest has crawled back over the past few weeks, rising from a low of $348 million on June 6 to $440 million.
Open interest is an important metric in trading because it reflects the level of demand in the futures market. A rising figure indicates that demand is gradually increasing.
This trend is happening as the weighted funding rate has remained in the green in the past few days. Also, spot market volume has been relatively stable during this period.
Therefore, the LINK price is falling due to the ongoing sell-off in the crypto industry, which has affected Bitcoin and most altcoins. After soaring to $67,000, Bitcoin has dropped to $63,000 today. Other top tokens like Ethereum, XRP, and Pi Network have all retreated in the past few days.
The sell-off has coincided with weakness in the stock market, with the Dow Jones Industrial Average, Nasdaq 100, and S&P 500 indices dropping over the past few days amid the ongoing US-Iran war.
Chainlink’s key metrics have also waned during the ongoing crypto market crash. For example, the amount of staked LINK tokens has dropped to $345 million from last year’s high of over $1 billion. The total value secured (TVS) in the network has dropped from last year’s high of $66 billion to the current $32 billion.




