
 Bitcoin
 Starknet
 Pearl
Pearl ZKsync
 NEAR Protocol
 Quantus
 Zerebro

Bitcoin price slipped toward $63,300 on July 28 as sellers reclaimed control across major exchanges. The move followed weaker liquidity, Binance selling, and delayed U.S. market-structure legislation. Binance data placed Bitcoin near $63,200, down roughly 3% over 24 hours.
The decline mattered because buyers failed to extend July’s recovery above resistance. Thin spot activity reduced market depth, while the Federal Reserve began a two-day policy meeting. Those conditions left traders exposed to sharper moves around guidance and technical levels.
Bitcoin Price Weakens as Spot Activity Contracts
Binance market data showed Bitcoin trading around $63,193 on July 28. The exchange recorded a $65,744 intraday high and a $63,059 low. Bitcoin’s 24-hour decline reached about 3%, confirming pressure below the prior range.
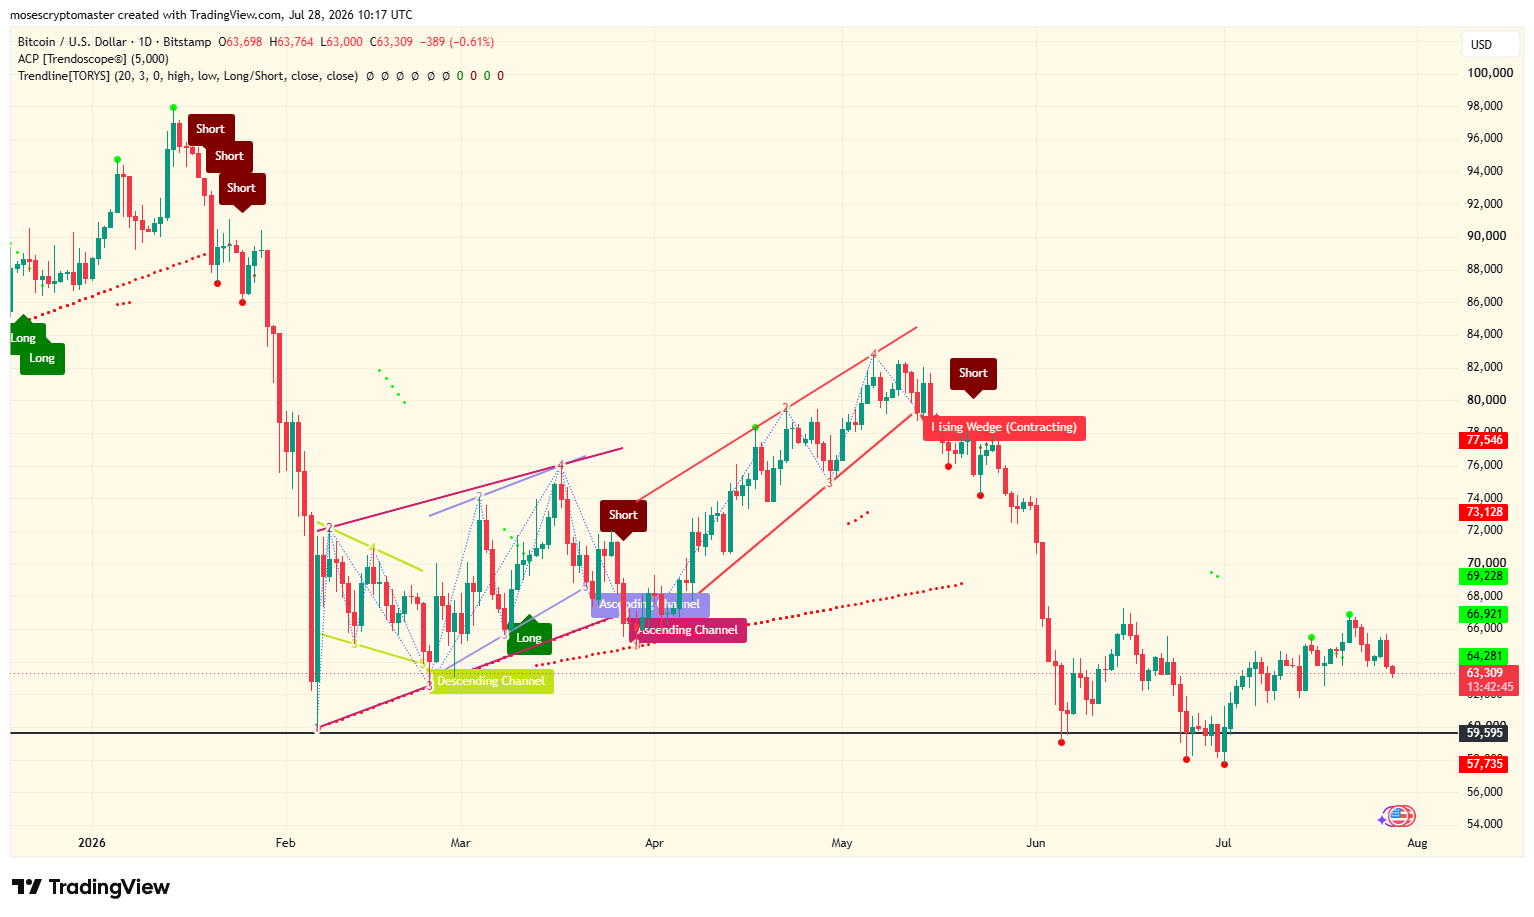
TradingView data placed the price of Bitcoin near $63,200. Its daily chart showed resistance around $66,900 and $69,200. The supplied chart marked support near $59,600 and $57,700.
CryptoQuant contributor Darkfost reported that July spot volumes remained far below late-2024 levels. His review estimated Binance volume above $35 billion during July. That compared with $246 billion during November 2024.
Darkfost also estimated volume declines of 85% on Bybit and 61% on Coinbase. OKX activity fell 67% over the same period. He said aggregate readings resembled activity last recorded during the 2023 bear market.
Lower volume can amplify short-term moves because fewer orders absorb aggressive trades. However, volume contraction alone does not establish a continuing decline. It shows weaker participation during Bitcoin’s latest recovery attempt.
Bitcoin Price Structure Shows Sellers Defending Recovery
The supplied Bitstamp daily chart showed Bitcoin closing near $63,438 on July 28. Price had broken below an ascending channel formed during April and May. Sellers later rejected a rebound around $82,000.
The chart then showed a steep June decline toward $58,000. Bitcoin recovered during July but failed near $67,000. That sequence created lower highs beneath the broken channel.
The current structure placed resistance between $64,300 and $66,900. A daily recovery above that region could reopen the $69,200 area. Continued rejection would leave the market testing $59,600 support.
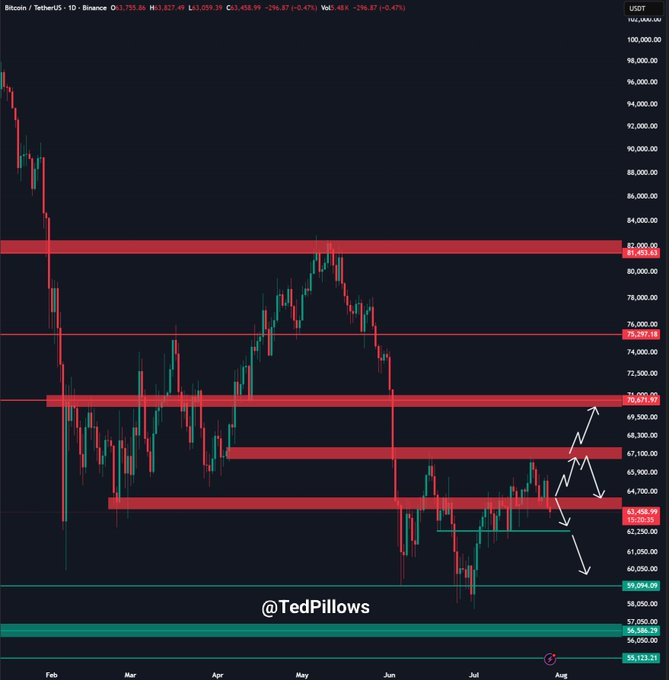
Ted, a market commentator, said Bitcoin failed to retain the $65,000 area. He identified $62,000 to $65,000 as the next support range. His assessment aligned with the failed rebound and declining July momentum.
The Digital Asset Market Clarity Act remained unresolved in the Senate. Congress.gov showed the House bill reached the Senate on Sept. 18, 2025. Lawmakers referred it to the Banking, Housing, and Urban Affairs Committee. The public record did not confirm final Senate passage.
That record supports regulatory delay as context, but not as Bitcoin’s sole driver. Spot liquidity, macro positioning, and technical selling offered separate explanations.
Exchange Data Signals Abnormal Downside Momentum
Arab Chain’s CryptoQuant analysis measured Bitcoin’s 24-hour Z-score at negative 3.51 near $63,300. The reading placed the move over three standard deviations below its recent average. Bitcoin’s corresponding return measured about negative 1.29% in that dataset.
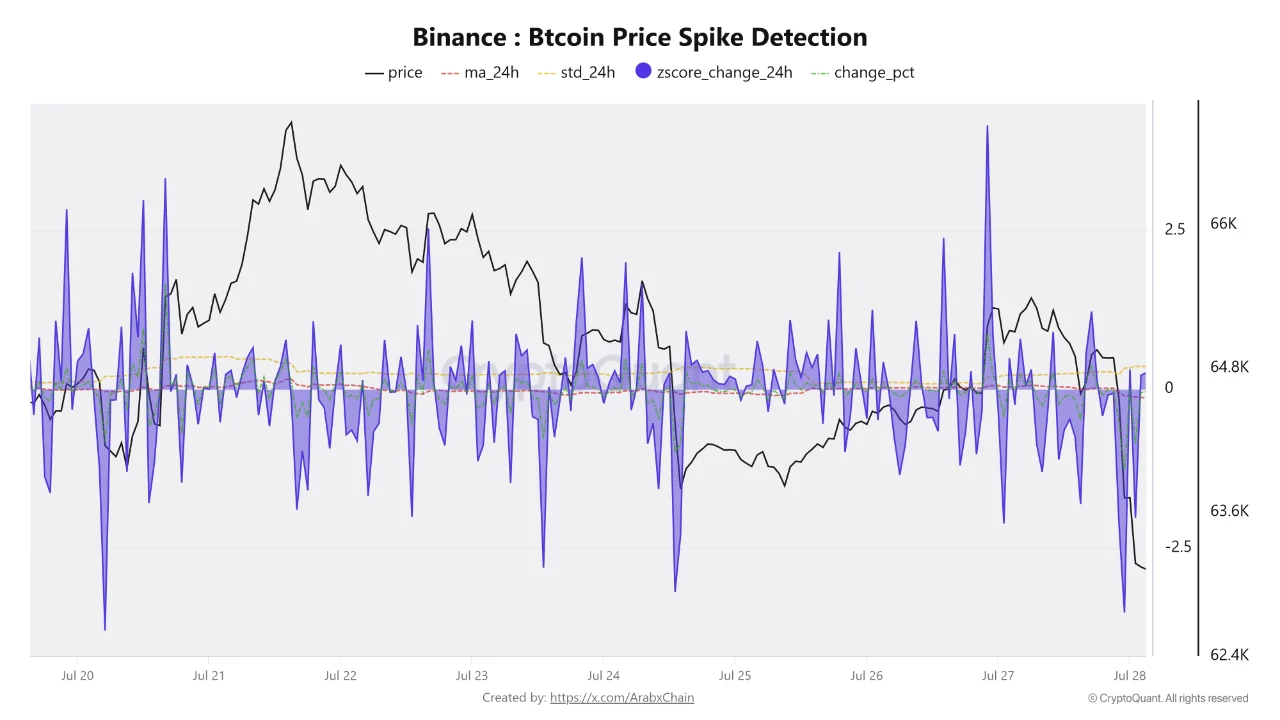
Such readings identify an unusual move rather than a fixed market direction. A return toward zero would indicate normalising momentum. Persistently negative readings would show continuing downside volatility.
Binance’s market page also showed roughly 15,768 Bitcoin in daily spot volume. That represented over $990 million at the quoted price. Exchange volume differed from broader totals because each dataset covered separate venues and periods.
The evidence showed concentrated selling within a low-participation market. It did not confirm capitulation or an immediate reversal. Traders still lacked rising spot demand capable of sustaining recovery.
Bitcoin Price Faces Fed Decision and Lower Support
The Federal Reserve scheduled its Federal Open Market Committee meeting for July 28–29. Its calendar also listed a press conference after the decision. Rate guidance could affect dollar liquidity and risk-asset demand.
The first downside area remained near $62,000, based on recent consolidation. The chart’s stronger reference sat around $59,600. A break below that level would expose June lows near $57,700.
Bitcoin price USD recovery required a daily close above $66,900 resistance. The next verifiable catalyst arrives with the Federal Reserve decision on July 29. Until then, weak volume leaves the price vulnerable to wider intraday swings.



